
Earth and Atmospheric Sciences
The relationship between world agriculture and rural land use is essentially one of mutual identity and competition. In most parts of the world, agriculture is the primary driver of how rural land is shaped, managed, and economically valued.
At its core, world agriculture is the dominant “user” of rural land, but it also competes with other rural land uses like forestry, conservation, and urban sprawl.1
1. Agriculture as the Primary Rural Land Use
Globally, agriculture occupies approximately 50% of the world’s habitable land.2 Because the vast majority of this land is located outside of cities, “rural land use” and “agricultural land use” are often used interchangeably in geographic studies.
- Livestock Dominance: Roughly 77% of global agricultural land is used for livestock (grazing and animal feed), making pastoralism the single largest human use of land on Earth.
- Cropland: The remaining land is dedicated to crops for human consumption, biofuels, and textiles.3
- Landscape Shaping: Agricultural practices dictate the “look” of rural areas—from the terraced hills of Southeast Asia to the vast, linear “township and range” grids of the American Midwest.
2. The Conflict Between Intensification and Expansion
As the world’s food demand rises, the relationship between agriculture and rural land evolves in two distinct ways:
- Extensification (Expansion): This involves converting “wild” rural land (forests, wetlands, or grasslands) into new farmland. This is the primary driver of deforestation in the Amazon and Sub-Saharan Africa.4
- Intensification: This involves producing more food on the same amount of land using technology, chemicals, and better seeds (The Green Revolution).5 While this saves forests from being cleared, it often leads to rural issues like soil degradation, water depletion, and the loss of small-scale family farms to large agribusinesses.
3. The “Rural-Urban” Fringe and Land Competition
Rural land is increasingly a site of conflict between agriculture and other modern needs:
- Urban Sprawl: As cities grow, they often gobble up the most fertile “prime” agricultural land first, because farms are usually located on flat, easy-to-build-on terrain.6
- Conservation vs. Production: Modern rural land use policies often force a choice between land sparing (intensifying farming in one area to leave another for nature) and land sharing (farming less intensively so that wildlife can coexist with crops).7
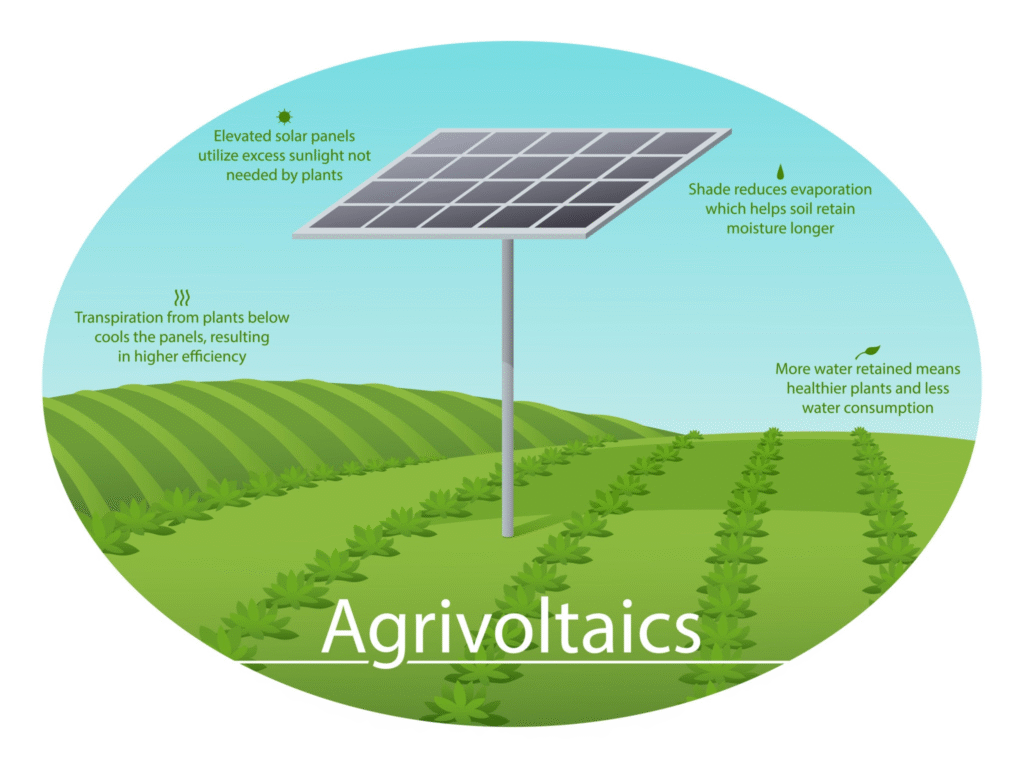
- Renewable Energy: A new trend in rural land use is the installation of solar farms and wind turbines on agricultural land, creating a dual-use landscape (often called agrivoltaics).
4. Economic and Social Influence
Agriculture determines the socio-economic fabric of rural areas:8
- Infrastructure: The location of rural roads, grain elevators, and irrigation canals is dictated by agricultural needs.
- Zoning: In many regions, “Agricultural Zoning” is a legal tool used to prevent rural land from being subdivided into residential suburbs, protecting the “Right to Farm” and keeping land prices low enough for farmers to afford.9
- Employment: In developing nations, agriculture can account for over 50% of rural employment, meaning the health of the agricultural sector directly dictates the survival of rural villages.10
Summary Table: Agriculture vs. Other Rural Uses
| Category | Agricultural Use | Non-Agricultural Rural Use |
| Direct Function | Food, fiber, and fuel production. | Conservation, recreation, and forestry. |
| Environmental Impact | High water use, potential chemical runoff. | Carbon sequestration, biodiversity habitat. |
| Spatial Pattern | Large, open fields or managed pastures. | Fragmented woodlots or protected wilderness. |
| Economic Driver | Commodity markets and exports. | Tourism, ecosystem services, and timber. |
How are environments transformed through agriculture?
Agriculture does not just “use” the environment; it fundamentally re-engineers it. This transformation occurs across three main dimensions: the physical landscape, the chemical composition of the soil and water, and the biological makeup of the ecosystem.1
1. Physical Transformation: The “Simplified” Landscape
Natural ecosystems are characterized by complexity, whereas agricultural environments are defined by simplification.2
- Deforestation and Land Clearing: To create space for crops, forests and grasslands are cleared.3 This removes the multi-layered canopy and root systems that protect soil, leading to increased erosion and the loss of “carbon sinks.”4
- Hydrological Engineering: Agriculture is the world’s largest consumer of freshwater.5 We transform environments by draining wetlands (removing natural flood buffers) and diverting rivers through massive irrigation systems to turn arid deserts into green fields.6
- Terracing and Leveling: In mountainous regions, humans physically reshape the earth into terraces to control water flow, while in flatlands, we “level” the terrain to accommodate heavy machinery.
2. Chemical Transformation: The “Nutrient Pulse”
To maximize yields, humans inject massive amounts of energy and chemicals into the environment, disrupting natural cycles.7
- The Nitrogen & Phosphorus Cycle: In nature, nitrogen is fixed slowly by plants. Agriculture uses synthetic fertilizers to flood the soil with nitrogen and phosphorus.8 Much of this “leaches” into groundwater or runs off into rivers.9
- Eutrophication: This chemical runoff leads to algal blooms in distant lakes and oceans.10 When the algae die and decompose, they strip the water of oxygen, creating “dead zones” where no aquatic life can survive.
- Pesticide & Herbicide Load: The introduction of synthetic chemicals to kill pests and weeds often has “non-target” effects, altering the chemistry of the soil and impacting beneficial insects like bees.11
3. Biological Transformation: Homogenization
Agriculture replaces high-biodiversity areas with monocultures—vast stretches of a single species.12
- Genetic Narrowing: Out of thousands of edible plants, just four crops (wheat, rice, maize, and barley) now dominate nearly 40% of all global cropland. This makes the environment biologically fragile and more susceptible to disease.
- Displacement of Wildlife: When a forest is replaced by a cornfield, the complex food web is destroyed. Specialized species are replaced by “generalist” species (like rodents or certain birds) that can survive in human-altered landscapes.
- Soil Microbiome Change: Intensive tilling and chemical use alter the microscopic life in the soil—fungi, bacteria, and earthworms—which are essential for long-term land health.
Summary of Environmental Shifts
| Feature | Natural Environment | Agricultural Environment |
| Species Diversity | High (Thousands of species) | Low (Monocultures) |
| Nutrient Cycle | Closed and slow | Open and rapid (Fertilizer-driven) |
| Water Flow | Natural absorption/filtration | Controlled irrigation/runoff |
| Carbon Status | Carbon Sink (Stores CO2) | Potential Carbon Source (Releases CO2, CH4) |
What is the diffusion of agriculture?
The diffusion of agriculture is the process by which agricultural ideas, techniques, and crops spread from their points of origin (known as hearths) to other parts of the world.1
This movement is rarely a single “wave”; instead, it happens through various geographic mechanisms that have shaped the global food system over thousands of years.
1. The Starting Points: Agricultural Hearths
Agriculture did not start in one place.2 It emerged independently in several “hearths” around 10,000–12,000 years ago, usually in fertile river valleys with stable climates.3
- Fertile Crescent (Southwest Asia): The earliest hearth.4 Spread wheat, barley, sheep, and goats into Europe and North Africa.
- East Asia (Yellow & Yangtze Rivers): The origin of rice and millet, which diffused throughout Southeast Asia.
- Mesoamerica: The hearth for maize (corn), beans, and squash, which spread north into the Americas.5
- Sub-Saharan Africa: Origin of sorghum, yams, and coffee.6
- Andean Highlands: Domesticated potatoes and llamas.7
2. Mechanisms of Diffusion
Geographers categorize the spread of agriculture into two primary types of diffusion:8
A. Expansion Diffusion (The Spread of Ideas)
This occurs when the agricultural practice spreads through a population while remaining strong in its hearth.9
- Contagious Diffusion: Like a ripple in a pond, farming techniques spread to neighboring groups through direct contact.10 For example, hunter-gatherers living next to early farmers in Europe gradually adopted grain cultivation.
- Stimulus Diffusion: A group adopts the idea of farming but changes the specific crop to fit their local climate. An example is the cultivation of “African Rice” ($Oryza$ $glaberrima$), which was developed based on the concept of Asian rice but using a native species.
B. Relocation Diffusion (The Movement of People)
This happens when farmers physically move to a new location, bringing their seeds and knowledge with them.11
- Migration: The most famous example is the Columbian Exchange.12 Following 1492, crops like potatoes and corn were relocated from the Americas to Europe/Africa, while wheat, cattle, and horses were moved to the Americas.13
- Demic Diffusion: This is a specific type of relocation where the farmers themselves expand into new territories, often replacing or absorbing the local hunter-gatherer populations (as seen in the spread of farmers from the Near East into Neolithic Europe).14
3. Modern Agricultural Diffusion
Today, diffusion happens at “warp speed” through technology rather than physical migration:
- The Green Revolution: In the mid-20th century, high-yield seeds and chemical fertilizers were diffused from laboratories in the U.S. and Mexico to developing nations like India and the Philippines to combat famine.15
- Hierarchical Diffusion: Modern “Precision Ag” tech often starts in wealthy, developed nations or large corporate agribusinesses (the “top” of the hierarchy) and slowly trickles down to smaller, more remote farms as the technology becomes cheaper.
Comparison of Diffusion Types
| Type | Mechanism | Historical Example |
| Contagious | Person-to-person contact. | Neighboring tribes in the Fertile Crescent learning to plant barley. |
| Relocation | Physical movement/migration. | European settlers bringing wheat and cows to the American Great Plains. |
| Hierarchical | Top-down (State or Corp). | The Green Revolution’s “miracle seeds” being distributed by governments. |
What is the human impact on the land?
The human impact on the land is primarily a story of transformation.1 We have modified over 75% of Earth’s ice-free land surface, moving more earth and sediment through farming and construction than all natural rivers and glaciers combined.2
While these changes have allowed us to support a population of 8 billion, they have fundamentally altered the planet’s “vital signs.”
1. Land Degradation and Soil Loss
The most direct impact is the literal “wearing out” of the earth.
- Erosion: Plowing (tilling) exposes topsoil to wind and rain.3 We are currently losing topsoil 10 to 40 times faster than it can naturally regenerate.4
- Desertification: In arid regions, a combination of overgrazing and deforestation strips the land of its protective cover, turning once-productive grasslands into non-productive deserts.
- Salinization: In poorly managed irrigation systems, water evaporates and leaves behind salt.5 Over time, the soil becomes too salty for any crops to grow, essentially “poisoning” the land for future use.
2. Habitat Fragmentation & Biodiversity Loss
By carving the landscape into “human-use blocks,” we disrupt the natural flow of life.6
- Island Effect: When we build roads or clear large farms, we leave small “islands” of natural habitat. Many species cannot survive in these small patches because they lack the space to hunt, find mates, or migrate.
- Biomass Shift: The biological “weight” of the planet has shifted dramatically. Today, 94% of the biomass of all land mammals is composed of humans and our livestock; wild animals make up only 6%.
3. Altering Global Cycles
Human land use has “unplugged” and rewired the Earth’s natural chemical and water systems.
- The Hydrological Cycle: By draining wetlands (which act as natural sponges) and paving over soil (urbanization), we have increased the frequency and severity of floods.7
- The Carbon Cycle: Forests and peatlands are massive “carbon sinks.”8 When we clear land for agriculture, that stored carbon is released into the atmosphere, making land-use change the second-largest driver of climate change after fossil fuel burning.
- The Nitrogen Cycle: Humans now fix more nitrogen (through fertilizer production) than all of Earth’s natural bacterial processes combined, leading to the chemical “overloading” of our waterways.
4. The “Built Environment” (Urbanization)
While cities occupy only about 3% of global land, their impact is disproportionately large.
- Soil Sealing: Urbanization involves “sealing” the soil under asphalt and concrete, which permanently destroys its ability to grow food, absorb water, or support life.
- Heat Islands: Cities absorb and hold heat, creating “Urban Heat Islands” that can be 9$1$–10$7$°F (11$0.5$–12$4$°C) warmer than the surrounding rural countryside, altering local weather and growing seasons.13
Summary of Human Footprint
| Impact Area | Natural State | Human-Impacted State |
| Soil | Rich in organic matter; stable. | Eroded, compacted, or salinized. |
| Water | Filtered by wetlands; slow-moving. | Diverted for irrigation; rapid runoff. |
| Wildlife | Diverse, connected food webs. | Fragmented; dominated by livestock. |
| Atmosphere | Balanced carbon exchange. | Net carbon source due to clearing. |
What factors affect rural land use?
Rural land use is not random; it is the result of a complex negotiation between the natural world, economic necessity, and human governance.1
Geographers generally group these influences into three major categories: Physical, Economic, and Social/Political factors.2
1. Physical Factors (The “Environmental Canvas”)
Before a single seed is planted, the physical environment sets the boundaries of what is possible.
- Climate: This is the most critical factor. Temperature and precipitation determine the “growing season.” For example, citrus requires warmth ($15$°C+), while wheat needs specific dry periods for harvesting.
- Soil Quality: The nutrient content (nitrogen, phosphorus), pH level, and texture (sandy vs. clay) dictate crop choice. Loam soils are prized for arable farming, while poorer soils might be relegated to grazing.3
- Topography (Relief): Flat land is ideal for large-scale machinery and crop farming.4 As the slope increases (over $20$°), farming typically shifts to livestock grazing or labor-intensive terracing to prevent erosion.
- Water Availability: Proximity to rivers or viable aquifers determines whether a farm can use intensive irrigation or must rely on dryland farming.
2. Economic Factors (The “Market Logic”)
Even if the land is perfect for a crop, a farmer won’t grow it if it doesn’t make financial sense.
- Distance to Market: Based on the Von Thünen Model, land use is often determined by how close it is to a city. Perishable goods (milk, berries) are produced close to the city, while “extensive” uses like grain or ranching happen further away where land is cheaper.
- Land Cost: In areas near expanding cities (the rural-urban fringe), land prices skyrocket. To survive, rural land users must switch to intensive land use (high-value crops like flowers or greenhouses) to cover the high taxes and mortgage costs.
- Transportation Infrastructure: The presence of highways, rail lines, or ports allows rural areas to specialize in “export crops” (like soybeans or coffee) rather than just feeding the local village.
3. Social and Political Factors (The “Human Choice”)
Government and culture often override pure environmental or economic logic.
- Government Policy & Subsidies: Many governments pay farmers not to grow certain crops to keep prices stable, or provide subsidies for “green” land uses like reforestation.5
- Zoning and Land Tenure: Laws often protect “Agricultural Reserves” from being turned into housing. Furthermore, land ownership (tenancy vs. private ownership) affects land use; owners are more likely to invest in long-term soil health than short-term renters.
- Technology: The “Digital Revolution” in agriculture (Agriculture 4.0) allows farmers to grow crops in environments that were previously “unfit” through the use of GMOs, hydroponics, and precision irrigation.
- Cultural Tradition: In many regions, land is used for specific livestock or crops because of deep-seated cultural identity or dietary taboos, even if another use would be more profitable.
Summary Table: Factors Influencing Land Use
| Factor Category | Example Influence | Resulting Land Use |
| Physical | Steep mountainous terrain | Pastoralism (Sheep/Goats) |
| Economic | Low transport costs / High demand | Commercial export crops (Soy/Corn) |
| Political | Government “Green” subsidies | Conservation or Carbon Sequestration |
| Social | Small family inheritance laws | Fragmented, subsistence garden plots |
What are site characteristics?
In geography, site characteristics refer to the specific physical and human features found at a precise location.1 While “location” tells you where a place is (coordinates), “site” tells you what the land is like.2
When we discuss site characteristics in the context of agriculture and rural land use, we are looking at the natural “ingredients” that make a piece of land suitable for a specific purpose.
1. Physical Site Characteristics
These are the natural features of the landscape.3 They are relatively permanent and dictate what can grow there.
- Climate: Average temperature, rainfall, and length of the growing season.4 (e.g., A “Mediterranean” site is perfect for olives).
- Soil Quality: The texture, depth, pH, and nutrient content of the earth.
- Topography (Relief): The shape of the land.5 Is it a flat floodplain (good for grain) or a steep mountainside (better for forestry or grazing)?
- Hydrology: The proximity to and availability of fresh water, such as rivers, springs, or high water tables.6
- Vegetation: The natural plant life currently occupying the site, which may need to be cleared or managed.7
2. Human/Cultural Site Characteristics
While geography often focuses on the physical, the “site” also includes man-made modifications to that specific land.
- Infrastructure: Existing buildings, fences, irrigation canals, or drainage systems built directly on the property.
- Land Tenure: The legal status of that specific plot (e.g., Is it privately owned, a communal tribal land, or a government lease?).
- Historical Use: Past activities, such as previous chemical use or “legacy” soil enrichment, that affect current productivity.8
“Site” vs. “Situation”
To understand site, it is helpful to compare it to its partner concept, situation.
| Feature | Site (Internal) | Situation (External) |
| Focus | The land itself. | The land’s surroundings. |
| Examples | Rich soil, flat terrain, water source. | Proximity to a city, near a highway. |
| Change | Difficult to change (mostly permanent). | Changes as cities grow or roads are built. |
| Impact | Determines what can grow. | Determines how much profit can be made. |
Example: A farm might have an excellent site (perfect soil and sun) but a poor situation (it is $500$ miles from the nearest market with no paved roads), making it difficult to run a successful commercial business.
Why It Matters in Rural Land Use
Site characteristics are the primary reason why we see specialization in agriculture. Farmers choose their land use based on the site’s strengths:
- Wet-point sites: Settlements and farms located near a reliable water source in an otherwise dry area.9
- Dry-point sites: Farms located on slightly higher ground to avoid seasonal flooding.10
- Aspect: In the Northern Hemisphere, south-facing slopes (a site characteristic) receive more sunlight, making them the preferred site for vineyards.11
What is the relationship between world cultural preference and perception?
In human geography, the relationship between world cultural preference and perception is a feedback loop: what a culture values (preference) dictates how its members see and interpret the environment (perception), which in turn reinforces those cultural values.
Think of culture as a lens. Two different people can look at the exact same piece of land, but because of their cultural “lenses,” they will perceive entirely different realities and possibilities.1
1. Perception: The “Mental Map”
Perception is the process by which we gather and interpret information about the world.2 It is rarely objective.
- Environmental Perception: This is how people view the hazards or opportunities in their surroundings.3 For example, a Western industrialist might perceive a fast-flowing river as a source of hydroelectric power, while a local indigenous community might perceive it as a sacred ancestor or a vital spirit.
- Cognitive Mapping: We don’t see the whole world; we see “versions” of it based on our needs. A farmer perceives a field in terms of soil drainage and slope, whereas a city developer perceives that same field in terms of its distance to the nearest highway.
2. Preference: The “Cultural Value”
Preference is the “choice” a culture makes based on its beliefs, identity, and history.
- Dietary Preferences: Culture determines what is considered “food.”4 In the U.S., there is a strong preference for beef, leading to a landscape dominated by cattle ranches. In India, religious preferences (Hinduism) lead to a perception of cows as sacred, meaning the land is used differently, even though the physical environment could support ranching.
- Architectural/Landscape Preference: Some cultures prefer “ordered” landscapes (symmetrical gardens, straight-row crops), perceiving nature as something to be controlled. Others prefer “organic” landscapes, perceiving nature as something to be harmonized with.
3. How Preference Shapes Perception (and vice versa)
The relationship works in three distinct ways:
A. Preference Filters Information
If a culture highly values economic growth, its people will “perceive” a forest primarily as a collection of timber (a commodity). They may literally stop “seeing” the biodiversity or the spiritual value because their preference for profit has filtered those perceptions out.
B. Perception Validates Preference
If you are raised in a culture that perceives the wilderness as “dangerous” or “waste land,” you will naturally develop a preference for urbanization or cleared farmland. Your perception of the danger justifies your preference for the change.
C. The Built Environment (The Result)
The physical world we see today—the “Cultural Landscape”—is the visible result of this relationship.
- The American Lawn: The preference for green, weed-free lawns stems from an English aristocratic aesthetic. Americans perceive a “good neighbor” as someone who maintains this lawn, which has turned millions of acres of rural and suburban land into a specific, high-maintenance ecosystem.
- Sacred Groves: In parts of Africa and India, cultural preference for spiritual sites leads to the perception of specific forests as “untouchable.”5 This perception has saved small pockets of high biodiversity from being turned into farmland.
Comparison of Perception vs. Preference
| Concept | Definition | Example in Land Use |
| Perception | How we interpret the land. | Seeing a swamp as a “nuisance” or a “nursery for fish.” |
| Preference | What we value or want. | Choosing to drain the swamp to build a shopping mall. |
| Interaction | The loop between the two. | A culture that values “progress” perceives wild land as “empty.” |
What are systems of production?
In geography, systems of production refer to the specific ways that resources (land, labor, capital) are organized to create agricultural products.1 These systems are defined by their inputs, processes, and outputs, and they determine the physical appearance and ecological health of rural land.2
Geographers generally classify these systems using three major “binary” frameworks.
1. Subsistence vs. Commercial Systems3
This classification is based on the purpose of the production—who is going to eat the food?4
- Subsistence Systems: The primary goal is to provide for the farmer’s family or local community.5 There is little to no surplus for sale.6
- Example: Shifting cultivation in tropical rainforests or nomadic herding in the Sahel.7
- Commercial Systems: The primary goal is profit.8 Food is grown for sale in regional or global markets. These are often integrated into “agribusiness” chains.9
- Example: Plantations (coffee, palm oil) or dairy farming in the United States.10
2. Intensive vs. Extensive Systems
This classification is based on the ratio of inputs to land area.11
- Intensive Systems: High amounts of labor or capital (money, technology) are applied to a relatively small area of land to maximize yield.12
- Labor-Intensive: Many people working small plots, often seen in Asian wet rice farming.
- Capital-Intensive:13 High use of machinery, fertilizers, and technology, like greenhouses or market gardening near cities.14
- Extensive Systems: Low amounts of labor and capital are applied to very large areas of land.15 The yield per acre is low, but the total output is high because of the massive scale.16
- Example: Cattle ranching in the Great Plains or the Amazon, and grain farming in the Canadian Prairies.
3. Specialized vs. Mixed Systems
This classification is based on the diversity of the output.
- Monoculture (Specialized): The system produces only one crop or animal species at a time.17 This is common in commercial systems to maximize efficiency but can lead to soil depletion and disease vulnerability.
- Mixed Crop and Livestock: The system integrates both plants and animals. Animals provide manure for the fields, and the fields provide feed for the animals. This creates a more “closed” loop that can be more sustainable.
Summary of Major Global Systems
| System Name | Type | Key Characteristic | Typical Location |
| Nomadic Herding | Subsistence / Extensive | Moving animals over wide areas for grazing. | Arid regions (North Africa, Central Asia) |
| Market Gardening | Commercial / Intensive | High-value fruits/veg grown near cities. | “Truck farming” in the SE United States |
| Plantation | Commercial / Intensive | Large-scale monoculture of “cash crops.” | Tropical regions (LDCs) for MDC markets |
| Livestock Ranching18 | Commercial / Extensive19 | Raising cattle or sheep on marginal lands.20 | Western USA, Australia, Brazil |
Comparing Intensive and Extensive Agriculture
This video provides a clear visual breakdown of how these two systems differ in terms of their impact on the land and their resource requirements.
What is subsidence, or peasant mode, of production?
In human geography and sociology, the peasant mode of production (often used interchangeably with subsistence agriculture) is a system where the main goal of farming is to meet the immediate needs of the family or community rather than to generate a profit.1
While “subsistence” describes the economic result (barely surviving), the “peasant mode” describes the social and political structure of the life.
1. Core Characteristics
The peasant mode of production is defined by a specific set of “rules” that separate it from modern industrial farming:2
- Production for Use, Not Exchange: The primary “customer” is the farmer’s own family.3 Any surplus is typically given to kin, traded locally for essential tools, or used for community celebrations rather than sold for capital investment.4
- Labor-Intensive vs. Capital-Intensive: Instead of using expensive tractors or chemicals (capital), the system relies on human and animal labor.5 The entire family—children, parents, and the elderly—participates in the work.
- Simple Technology: Tools are often traditional and hand-operated, such as hoes, machetes, and wooden plows.6
- Ecological Harmony: Because peasant farmers depend on the same small plot of land for generations, they often use sustainable “agroecological” methods like crop rotation, intercropping, and natural composting to maintain soil fertility without buying fertilizer.7
2. The Social Structure of “The Peasant”
The term “Peasant Mode” also implies a specific relationship to power and the land:
- Land Tenure: Peasants often do not own their land in the way we think of private property.8 Historically, they might have been “tenants” who paid rent or taxes to a landlord or a state in exchange for the right to farm.9
- Inelastic Labor: Unlike a factory worker who might work extra hours for a bonus, a peasant often works only as much as is needed to satisfy family hunger and social obligations. Once those needs are met, they often prioritize leisure or community time over “extra” profit.10
- The “Safety Net”: The peasant mode is deeply embedded in social networks.11 If one family’s crop fails, the community often shares its surplus. This “moral economy” acts as insurance against famine.
Comparison: Peasant vs. Entrepreneurial (Commercial) Farming
| Feature | Peasant Mode | Commercial Mode |
| Primary Goal | Survival & Family Consumption | Profit & Market Accumulation |
| Main Input | Family Labor | Machinery & Chemicals (Capital) |
| Market Role | Limited/Local Trade | Integrated Global Supply Chains |
| Land Use | Diverse crops (Biodiversity) | Large-scale Monocultures |
3. Why it Still Exists: “Repeasantization”
Despite the spread of global capitalism, the peasant mode remains the livelihood for hundreds of millions of people globally.
- Resilience: It is often more resistant to global economic crashes because the farmer isn’t dependent on buying expensive seeds or fuel.
- Food Security: In many developing regions, peasant farming provides a more reliable food source for the poor than relying on volatile global food prices.12
Subsistence vs Small-Scale Farming
This video highlights the subtle but important differences between farming strictly for survival and the transition into small-scale market participation.
What is commercial model of production?
The commercial model of production, often referred to as commercial agriculture or agribusiness, is a system where the primary goal is to maximize profit by producing food and fiber for sale in regional, national, or global markets.1
Unlike the subsistence (peasant) model, which focuses on feeding the farmer’s family, the commercial model treats the farm as a professional business entity integrated into a vast industrial supply chain.2
1. Defining Characteristics
The commercial model is defined by its scale and its reliance on external inputs rather than local tradition.3
- Market Orientation: The “customer” is not the farmer, but rather food-processing companies (like Nestlé or Tyson), wholesalers, or international commodity markets.4
- Large-Scale Operations: To achieve economies of scale, commercial farms often utilize vast tracts of land.5 This reduces the cost of production per unit of output (e.g., the cost to produce one bushel of corn).
- Capital-Intensive: Instead of relying on human labor, these systems require massive financial investment in state-of-the-art machinery (tractors, combines), high-tech irrigation, and land acquisition.6
- Technological Sophistication: Commercial models prioritize high-yield varieties (HYVs), synthetic fertilizers, chemical pesticides, and increasingly, “Agriculture 4.0” tools like GPS-guided drones and soil sensors.7
2. The Concept of Agribusiness
The commercial model is rarely just about the farm; it is part of agribusiness—the sum total of all operations involved in the manufacture and distribution of farm supplies, production on the farm, and the processing/storage of the final goods.8
- Vertical Integration: Large corporations may own every step of the process—from the seed laboratory and the fertilizer plant to the farm itself and the grocery store distribution center.9
- Global Supply Chains: A commercial farm in Brazil might grow soybeans specifically to be shipped to China to feed pigs that will eventually be sold as pork in Japan.
3. Types of Commercial Production
| System | Primary Product | Characteristic |
| Grain Farming | Wheat, Corn, Rice | Highly mechanized; located in large plains (USA, Ukraine). |
| Plantation Agriculture | Coffee, Rubber, Tea | Large-scale monoculture in tropical regions; often export-only. |
| Dairy Farming | Milk, Cheese | Located near urban centers (Milksheds) due to perishability. |
| Livestock Ranching | Beef, Sheep | Extensive land use; grazing on land too dry for crops. |
| Commercial Gardening | Fruits, Vegetables | Also called “Truck Farming”; intensive and high-value. |
4. Human and Environmental Impact
While the commercial model is incredibly efficient at producing high volumes of food, it creates significant shifts in the rural environment:10
- Rural Depopulation: Because machines replace people, fewer workers are needed, leading to the decline of small rural towns.11
- Environmental Stress: Intensive chemical use can lead to eutrophication (water pollution) and soil degradation.12
- Monocultures: Planting only one crop over thousands of acres creates “biological deserts” that are highly vulnerable to specific pests or diseases.13
Commercial vs. Subsistence Agriculture
This video provides a deep dive into the specific economic and geographic characteristics that define commercial agriculture and its role in the modern global economy.
What is the socialist mode of production?
The socialist mode of production in agriculture is a system where the private ownership of land and the means of production is replaced by social or state ownership.1 The primary goal is not profit (as in the commercial model) or simple family survival (as in the peasant model), but rather production for social use according to a centralized or community-driven plan.2
In the 20th century, this model was most famously implemented in the Soviet Union, China, and Eastern Europe through a process known as collectivization.3
1. Core Institutional Structures
The socialist model typically organizes rural land into two types of large-scale units:4
- Collective Farms (Kolkhozy):5 Land and resources are technically owned by a group of farmers who work together as a cooperative.6 While they “own” the farm collectively, the state typically dictates what they grow and how much they must sell back to the government at fixed prices.
- State Farms (Sovkhozy): These are essentially “factories in the fields.” The land is owned directly by the government, and the farmers are employees who receive a fixed wage, similar to factory workers.
- Machine-Tractor Stations (MTS): Because individual small farms cannot afford heavy machinery, the socialist state often centralizes equipment (tractors, combines) in central hubs that are “lent out” to various collective farms.7
2. Key Characteristics
- Abolition of Private Property: Land is viewed as a national resource. This prevents “landlessness” among the poor but also removes the individual farmer’s right to sell or buy land.
- Central Planning: Instead of market prices signaling what to plant, a central government agency creates a “Five-Year Plan” (or similar) that sets production quotas for grain, meat, and milk.8
- Elimination of the “Middleman”: The state acts as the sole buyer and distributor, aiming to keep food prices low for urban industrial workers.
- Industrialization of the Countryside: The socialist model seeks to turn “peasants” into “agricultural workers” by introducing modern technology and scientific farming to rural areas on a massive scale.9
3. Impact on Rural Land Use
The socialist mode creates a very distinct physical landscape:
- Field Consolidation: Small, irregular peasant plots are merged into massive, rectangular fields to accommodate large-scale machinery.10 This dramatically changes the “texture” of the rural landscape.
- Rural Transformation: Significant investment is often made in rural infrastructure—such as irrigation canals, schools, and hospitals—to bridge the gap between “urban” and “rural” qualities of life.
- The “Private Plot” Paradox: In many socialist systems, farmers were allowed to keep tiny (less than 1 acre) private garden plots for their own use.11 Historically, these tiny plots were often far more productive than the massive collective fields, providing a large percentage of a country’s fruits, vegetables, and eggs.
Summary Table: Socialist vs. Commercial vs. Peasant
| Feature | Peasant Mode | Commercial Mode | Socialist Mode |
| Ownership | Traditional/Family | Private/Corporate | State/Collective |
| Goal | Family Survival | Maximum Profit | National Social Needs |
| Decision Maker | The Head of Household | The Market/Owner | Central Government Plan |
| Land Pattern | Small, fragmented | Large, consolidated | Massive, consolidated |
4. Historical Outcomes
While the socialist mode succeeded in rapid industrialization and eliminating feudal land ownership, it often faced significant challenges:
- Incentive Problems: Without a profit motive or direct ownership, productivity often lagged because farmers felt like “cogs in a machine.”12
- Famines: Rapid, forced collectivization (notably in the USSR in the 1930s and China in the late 1950s) led to catastrophic disruptions in food cycles, resulting in millions of deaths.
- Transition: Since the late 20th century, most socialist countries (like China and Vietnam) have moved toward a “Market Socialist” or “Household Responsibility” system, giving land use rights back to individual families while keeping formal ownership in state hands.
How do the three systems of production compare?
The three systems of production—Peasant (Subsistence), Commercial (Agribusiness), and Socialist (Collectivized)—represent different philosophies on how land, labor, and capital should be organized to feed a population.
While all three aim to produce food, they differ fundamentally in their “logic of production.”
1. The Core Comparison
The table below highlights the divergent goals and structures of the three models.
| Feature | Peasant / Subsistence | Commercial / Agribusiness | Socialist / Collectivized |
| Primary Goal | Family survival & social reproduction. | Profit maximization & market share. | National food security & social equity. |
| Target Audience | The farm family and local village. | Global and regional consumers. | The state and industrial urban workers. |
| Land Ownership | Traditional/communal or small private plots. | Large private estates or corporate-owned. | State-owned or large-scale collectives. |
| Main Input | Labor: Family and animal power. | Capital: Machinery, chemicals, and tech. | State Assets: Centralized machinery and planning. |
| Landscape Style | Small, irregular, high-biodiversity plots. | Massive, geometric monocultures. | Huge, consolidated “factory” fields. |
2. Economic Logic: Risk vs. Efficiency
- Peasant Model (Stability): This system is designed for low risk. Peasants often plant multiple varieties of crops (intercropping) so that if one fails, the family still eats.1 Success is measured by “having enough.”2
- Commercial Model (Efficiency): This system is designed for high volume.3 By specializing in a single crop (monoculture), farmers can use specialized machines to produce at the lowest possible cost per unit. Success is measured by “return on investment.”
- Socialist Model (Output): This system is designed for quota fulfillment. The government provides the inputs (tractors/seeds), and the farm provides the product at a fixed price. Success is measured by “meeting the Five-Year Plan.”
3. Human and Social Impact
- The Peasant is a “jack-of-all-trades.” They are the owner, manager, and laborer all in one. The community is tight-knit, but vulnerable to local drought or famine.
- The Commercial Farmer is a “manager.” In this system, rural areas often lose their population (rural-to-urban migration) because machines replace the need for large families or human workers.
- The Socialist Worker is a “wage laborer.” The goal was to remove the “backwardness” of the peasantry by giving them the same status as urban factory workers—complete with state-provided healthcare and housing on the farm.
4. Environmental Legacy
- Peasant: Generally sustainable over centuries but struggles to feed rapidly growing urban populations.
- Commercial: High productivity but risks soil exhaustion, water depletion, and chemical pollution.
- Socialist: Often characterized by massive engineering (like the draining of the Aral Sea for cotton) which can lead to large-scale, unintended ecological disasters.
Summary Table: Which System “Wins”?
| If the goal is… | The best system is… | Why? |
| Global Scale | Commercial | It produces the highest volume of calories for the lowest price. |
| Local Resilience | Peasant | It requires the least amount of “outside” money or fuel to survive. |
| Social Equality | Socialist | It prevents land from being concentrated in the hands of a few wealthy elites. |
What is the relative location of farms?
In geography, the relative location of a farm describes its position in relation to other human and physical features, such as markets, transportation hubs, or other land uses.1
While absolute location tells you exactly where a farm is on a map (its coordinates), relative location tells you why a farm is there and how it connects to the rest of the world.
1. The Von Thünen Model: Proximity to Market
The most famous theory regarding the relative location of farms is the Von Thünen Model. It suggests that the type of farming practiced on a piece of land is determined by its distance from an urban center (the market).2
- The Inner Ring (High Perishability): Intensive farming, such as dairy and “market gardening” (fruits/vegetables), is located closest to the city.3 Because these products spoil quickly and are expensive to transport, their relative location must be near the consumer.
- The Outer Rings (Extensive Land Use): Crops like wheat or corn, and activities like cattle ranching, are located further away. These products are easier to transport and require large amounts of land, which is cheaper the further you get from the city.
- The “Wilderness” Limit: Eventually, a farm’s relative location becomes too distant for profit, as the cost of transporting the goods to the market exceeds the sale price.
2. Proximity to Infrastructure
The relative location of a farm is often defined by its access to “movement corridors.”
- Transport Hubs: Many commercial farms are located specifically near rail lines, major highways, or deep-water ports. This allows them to “relate” to global markets rather than just local ones. For example, a soybean farm in Brazil is strategically located relative to the ports that ship to China.
- Labor Sources: Intensive farms (like those for hand-picked berries) must be located relative to a reliable source of seasonal labor, often near border regions or rural towns with high populations.
3. Physical Relative Location (Site Context)
A farm’s location is also described in relation to natural landmarks:
- Windward vs. Leeward: A farm’s position relative to a mountain range determines its rainfall. Farms on the “windward” side receive moisture, while those on the “leeward” side (the rain shadow) may require intensive irrigation.4
- Upstream vs. Downstream: A farm’s relative location on a river dictates its water quality and flood risk. A farm located downstream from an industrial city may face water pollution issues that an upstream farm does not.
Comparison: Absolute vs. Relative Location of a Farm
| Feature | Absolute Location | Relative Location |
| Example | 41.8781° N, 87.6298° W | “50 miles west of Chicago along I-80” |
| Focus | Precision and Mapping | Context and Economics |
| Utility | Used for GPS-guided tractors and drones. | Used for choosing which crops will be profitable. |
| Stability | Fixed; coordinates never change. | Dynamic; changes if a new highway is built or a city expands. |
4. Why Relative Location Changes
Unlike absolute location, relative location is dynamic.
- Urban Sprawl: As a city grows, a farm that was once in the “outer ring” (ranching) might find itself in the “inner ring” (housing or dairy), forcing the farmer to change how they use the land.
- New Technology: The invention of refrigerated trucking (the “Cool Chain”) changed the relative location of dairy farms, allowing them to be located much further from cities than they were in the 1800s.
What is Von Thunen’s Model?
Created in 1826 by Johann Heinrich von Thünen, the Von Thünen Model is a foundational theory in human geography that explains how agricultural land use is organized around a central market.
The model’s core idea is that the type of farming a person chooses depends on two costs: the cost of the land and the cost of transporting goods to the market.
1. The “Isolated State” Assumptions
To create his model, von Thünen imagined an ideal “Isolated State” with specific rules to eliminate messy real-world variables:
- The Land is a Flat Plain: There are no mountains, rivers, or valleys to block travel (isotropic surface).
- Soil and Climate are Uniform: Every inch of land is equally fertile.
- One Market: All farmers sell their produce in a single central city.
- Simple Transport: Farmers transport goods themselves via horse and wagon (no railroads or highways).
- Profit-Seeking Farmers: Farmers are “rational” and will always choose the crop that makes the most money after paying for land and transport.
2. The Four Concentric Rings
Von Thünen predicted that farming would organize itself into four distinct rings around the city:
Ring 1: Dairying and Intensive Farming
- What: Milk, fresh fruits, and vegetables.
- Why: These products are highly perishable (they spoil fast) and require high-speed transport. They are also intensive, meaning they produce a lot of value on a small amount of land, allowing farmers to afford the expensive rent near the city.
Ring 2: Timber and Firewood
- What: Forests for fuel and building materials.
- Why: In the 1820s, wood was the primary source of heat and cooking. It is extremely heavy and bulky, making it very expensive to transport. Keeping it close to the city saved on transport costs.
Ring 3: Extensive Field Crops
- What: Grains like wheat, corn, and barley.
- Why: Grains are non-perishable (they don’t spoil quickly) and are relatively light. Because they require huge amounts of land to be profitable, they are located where land is cheaper, further from the city.
Ring 4: Livestock Ranching
- What: Raising cattle, sheep, and pigs.
- Why: This is the most extensive use of land. Animals need massive grazing areas, which are only affordable in the furthest ring. Conveniently, animals are self-transporting—they can walk themselves to the city for slaughter, keeping transport costs low.
3. The Bid-Rent Theory
The mathematical engine behind the rings is Bid-Rent Theory. It explains that different land users are willing to pay different amounts for land based on its distance from the market.
- Near the city: Rent is high. Only high-profit, perishable items (like flowers or milk) can “outbid” others for this land.
- Far from the city: Rent is low. Only crops that require massive space (like wheat) or low transport costs (like cattle) can survive here.
4. Is the Model Still Relevant?
While we no longer rely on firewood and we have refrigerated trucks, the model’s logic still applies:
- Modern Relevance: We still see “market gardening” (like berry farms or greenhouses) located closer to urban centers, while massive cattle ranches remain in remote areas like the Australian Outback or the American West.
- Limitations: Global trade and refrigeration (the “cool chain”) have “stretched” the rings. Now, a “local” market for a farmer in Chile might actually be a grocery store in London.
What is the Law of Diminishing Returns and the Concept of Rent?
In agricultural geography, the Law of Diminishing Returns and the Concept of Rent are the two economic “gears” that determine how intensely a piece of land is farmed and who gets to use it.1
1. The Law of Diminishing Returns
This law states that if you keep adding more of one factor (like fertilizer or labor) to a fixed amount of land, the extra amount of food you get will eventually start to decrease.2
- Stage 1 (Increasing Returns): At first, adding fertilizer helps a lot.3 Your yield jumps significantly.
- Stage 2 (Diminishing Returns):4 You add more fertilizer, but the plants can only absorb so much. The yield still grows, but by smaller and smaller amounts.5
- Stage 3 (Negative Returns):6 You add so much fertilizer that it actually poisons the soil or “burns” the plants. Total production actually goes down.7
Why it matters: This law tells a farmer exactly when to stop spending money on “inputs.” It proves that you cannot feed the entire world from a single flowerpot just by adding infinite fertilizer.
2. The Concept of Rent
In geography, “Rent” (specifically Economic Rent or Land Rent) is not just the monthly check you pay a landlord. It is the surplus value or advantage that one piece of land has over another.8
There are two main ways geographers look at rent:
A. Ricardian Rent (Fertility Rent)
Proposed by David Ricardo, this theory says that rent is based on natural quality.9
- If you have “Grade A” fertile soil, you produce more grain with less work than someone on “Grade C” sandy soil.10
- The extra profit you make simply because your dirt is better is called Ricardian Rent.
B. Von Thünen Rent (Location Rent)
As we discussed with the Von Thünen model, this rent is based on distance to the market.11
- Two farms might have the exact same soil, but Farm A is next to the city and Farm B is 100 miles away.
- Farm A saves a fortune on transport costs. That “saved money” becomes Location Rent, which is why land near cities is so expensive.
3. The Relationship Between the Two
These two concepts work together to create the “Intensity” of land use:
- High Rent = Intensive Use: If land is expensive (near a city or very fertile), the farmer must use high amounts of labor and technology to make enough money to “pay” that rent.
- The Ceiling: The farmer will keep adding labor and tech until the Law of Diminishing Returns kicks in and the cost of the next bag of fertilizer is higher than the value of the extra grain it produces.
Summary Comparison
| Concept | Focus | Core Logic |
| Diminishing Returns | Productivity | “More stuff doesn’t always mean more profit.” |
| Ricardian Rent | Quality | “Good soil makes more money than bad soil.” |
| Von Thünen Rent | Location | “Being close to the market is worth paying for.” |
The Law of Diminishing Marginal Returns
This video provides a visual explanation of how adding inputs to a fixed resource leads to smaller gains, which is a key reason why agricultural intensity varies by location.
What is the isolated state?
The Isolated State (1$Der$ 2$Isolierte$ 3$Staat$, 1826) is the name of the book and the central thought experiment created by German economist and geographer Johann Heinrich von Thünen.4
He used this concept as a “geographical laboratory” to strip away the complexities of the real world so he could study one single variable: how distance to the market dictates land use.5
1. The Laboratory Conditions (Assumptions)
To make his model work, von Thünen imagined an “Isolated State” that followed these strict, artificial rules:6
- Absolute Isolation: The state is a self-sufficient world with only one central city and no trade with other countries.7
- Isotropic Plain: The land is perfectly flat with no rivers, mountains, or valleys to block movement.8
- Uniform Fertility: Every inch of soil has the exact same quality, and the climate is the same everywhere.9
- Uniform Transport: There are no roads or rails.10 Farmers transport goods themselves via horse and wagon directly to the city.11
- Economic Rationality: All farmers aim to maximize their profit and will immediately change their crops if a more profitable option exists.12
2. Why “Isolated”?
By calling it an “Isolated State,” von Thünen was essentially creating a control group. He wanted to prove that even if the land was perfectly equal, spatial patterns would still emerge simply because of the cost of moving goods.13
In this world, the only thing that changes as you move away from the city is the cost of transportation.14
3. The Resulting Pattern
In this “Isolated State,” von Thünen calculated that the landscape would naturally organize into concentric rings:15
- Ring 1 (Intensive/Perishable): Dairy and vegetables (must be close to avoid spoiling).16
- Ring 2 (Bulky/Heavy): Forest/Timber (too heavy to carry long distances; remember, this was before coal, so wood was the primary fuel).17
- Ring 3 (Extensive Field Crops): Grains (lightweight and don’t spoil quickly).18
- Ring 4 (Livestock): Ranching (animals are “self-transporting”—they can walk to the city).19
- The Wilderness: Beyond this point, the cost of transport is higher than the price of the goods, so the land is left untouched.
4. Modern Modifications
Von Thünen himself acknowledged that his “Isolated State” was a simplification. He later added “modifiers” to show how the rings would change:
- Navigable Rivers: A river would “stretch” the rings outward because water transport is cheaper than land transport.20
- Secondary Markets: Adding smaller towns would create smaller “sub-rings” that overlap with the main city’s rings.
The Big Picture
The “Isolated State” is significant because it introduced the concept of Locational Rent: the idea that the value of land isn’t just about how “good” the soil is, but how useful its location is relative to where people live.21
Von Thünen Model Explained
This video explains how the Isolated State model works and why it remains a fundamental concept for understanding the spatial organization of agriculture today.
Does Von Thunen’s model accurately describe reality?
In short: No, the model does not accurately describe the physical reality of the 21st century, but yes, it accurately describes the economic logic that still governs where we choose to farm.
Von Thünen never intended his “Isolated State” to be a literal map of the world. Instead, he built it as a “normative model”—a simplified version of reality used to understand the relationship between distance and profit.
1. Where the Model Fails (Modern Reality)
Several technological and social revolutions have “broken” the neat concentric rings of the 1800s:1
- Refrigeration (The “Cool Chain”): Perishability was Von Thünen’s primary constraint. Today, refrigerated trucks and planes allow milk from New Zealand or berries from Mexico to be sold in London. The “first ring” is now global.
- Transportation Improvements: The model assumes slow horse-and-wagon transport.2 High-speed rail, massive container ships, and interstate highways have drastically lowered the cost of moving goods, making distance a much less important factor.3
- Replacement of Fuel: Von Thünen placed a forest in the second ring because wood was the only fuel for heating and cooking.4 Today, we use electricity and gas, so we no longer need “fuel forests” near our cities.
- Global Markets: Modern farms aren’t “isolated.”5 A farmer in Iowa doesn’t just sell to Chicago; they sell to a global market where prices are set in New York or Shanghai.
2. Where the Model Succeeds (The “Logic” Remains)
Even though the physical rings have changed, the underlying principles are still visible if you look closely:6
- The Bid-Rent Logic: Land near cities is still the most expensive.7 Because of this, you will rarely see a low-profit cattle ranch right next to a major city. Instead, you see “intensive” uses like nurseries, greenhouses, and sod farms—high-value products that can afford the high property taxes.
- Specialty Regions: While the rings aren’t circular, we still see “zones” of production.8 For instance, the “Milksheds” of the Northeast U.S. or the “Market Gardening” (truck farming) in the Southeast still relate to their distance from the massive population centers of the Atlantic coast.
- Developing Nations: In regions with poor infrastructure and limited refrigeration, the Von Thünen model still describes reality quite well. In parts of Sub-Saharan Africa or Central Asia, you will still find intensive vegetable gardens near villages and extensive grazing far out in the “wilderness.”
Summary of Reality vs. Theory
| Model Assumption | Modern Reality | Impact on the Model |
| Isolated State | Globalized trade networks. | Farms serve distant markets, not just local ones. |
| Horse & Wagon | Trucks, ships, and planes. | Transportation cost is no longer strictly linear with distance. |
| Isotropic Plain | Mountains, rivers, and varying soil. | Landscape features “warp” the rings into irregular shapes. |
| Perishability | Refrigerated “Cool Chains.” | Perishable goods can be grown thousands of miles away.9 |
How does Von Thunen’s model make predictions at the local scale?
At the local scale, Von Thünen’s model functions as a predictive tool for land-use intensity and crop selection.1 It suggests that if you start at the center of a town and drive outward, you will see a predictable “ladder” of agricultural activities based on how much a farmer can afford to pay for land (Bid-Rent) and how much it costs to move their specific product (Transport Cost).2
Here is how the model makes specific predictions for a local area:
1. Predicting Land-Use Intensity
The model predicts that land closest to the city will be used intensively, while land further away will be used extensively.3
- Near the Town: High land values mean farmers must produce a lot of value on a small amount of space.4 You will see greenhouses, vertical farms, or densely planted “truck farms” (vegetables). Inputs like labor and fertilizer are high per acre.
- Far from the Town: Low land values allow for low-intensity use. You will see massive fields of grain or large cattle ranches where the “input per acre” is very low.
2. Predicting Crop Types (The Perishability Rule)5
At a local level, the model predicts that “time-sensitive” products will cluster near the market.
- The Dairy/Berry Zone: Because fresh milk and berries spoil quickly, the model predicts these farms will be located in the immediate “milkshed” or “market garden” surrounding the city to minimize travel time.6
- The Grain/Livestock Zone: Because wheat doesn’t rot and cattle can be walked to market (self-transporting), these can be located much further away where land is cheaper.
3. The “Zoning” Effect of Bid-Rent7
The model predicts exactly where one type of farming will stop and another will begin. This is called the Margin of Cultivation.8
- It predicts that a vegetable farmer will “outbid” a wheat farmer for land 5 miles from the city because the vegetable farmer makes enough profit to cover the high rent.
- At 30 miles out, the transport costs for vegetables become so high that the vegetable farmer can no longer afford the rent. At this specific point, the model predicts the land use will flip to wheat or ranching.
How Local Features “Warp” the Predictions
In a real local setting, the “perfect rings” are almost always distorted by two main factors:
| Feature | Predictive Change |
| Highways/Rivers | The rings “stretch” along the transport route. High-value crops will move further away from the city if they are next to a fast road or cheap river transport. |
| Secondary Towns | A smaller nearby town will create its own mini-rings, causing “interference” patterns where two different market demands compete for the same land. |
Summary of Local Predictions
| Activity | Distance from Center | Economic Justification |
| Market Gardening | 0–10 miles | High perishability; high value covers high rent. |
| Dairy Farming | 10–20 miles | High transport frequency; high value. |
| Field Crops (Grain) | 20–50 miles | Low perishability; needs cheap, large-scale land. |
| Ranching | 50+ miles | Animals self-transport; lowest land cost required. |
How does Von Thunen’s model make predictions on the regional scale?
On a regional scale (spanning hundreds or thousands of miles), Von Thünen’s model expands from simple “rings” around a single city into broad zones of specialization that serve an entire regional or national economy.
While local scale predictions focus on property taxes and immediate transport, regional predictions focus on climatic suitability and large-scale infrastructure.
1. The Creation of “Agricultural Belts”
At the regional scale, the model predicts that entire states or provinces will specialize in specific commodities based on their relative distance to major population centers (like the BosWash megalopolis in the US or the Yangtze River Delta in China).
- The Intensive Core: Regions immediately surrounding massive urban clusters (the “Core”) will specialize in perishables and high-value horticulture. For example, New Jersey is known as the “Garden State” because of its historical regional role in providing fresh produce to New York and Philadelphia.1
- The Extensive Periphery: Regions thousands of miles away (the “Periphery”) will specialize in staple grains and livestock. The model predicts that the Great Plains or the Australian Outback will remain sparsely populated ranching and wheat zones because the land is cheap and the products are easy to ship long distances.2
2. The Impact of Transport Corridors (Warped Rings)
On a regional level, Von Thünen’s concentric circles are almost always “warped” into linear shapes by major transport infrastructure.
- Linear Diffusion: Instead of circles, land use follows Highways, Rail Lines, and Navigable Rivers. A region 500 miles away might behave like it’s only 50 miles away if it is connected by a low-cost waterway.
- The “Cool Chain” Extension: Regionally, the model predicts that the “Dairy Belt” can move further away from the population core as refrigeration technology improves. This is why Wisconsin can remain a major dairy provider for the entire central and eastern US, despite its distance from the largest coastal cities.
3. Comparative Advantage and Regional Rent
The model at this scale incorporates the idea that different regions have different “locational rents.”3
- Land Values: Regions near the urbanized “core” have higher land values due to competing uses (housing, industry).4 The model predicts that agriculture in these regions must be hyper-intensive (greenhouses, hydroponics) to survive.
- Climatic Overlays: While Von Thünen assumed a flat, uniform plain, regional predictions must account for climate. The model suggests that if a distant region has a “perfect” climate for a high-value crop (like California’s Central Valley), the high yield can offset the massive transportation costs to the distant East Coast market.
Summary of Regional Predictions
| Zone | Regional Role | Example (North America) |
| Core-Adjacent | High-value, perishable goods. | Florida/California (Winter fruit/veg) |
| Mid-Distance | Processed dairy and bulkier crops. | Wisconsin (Cheese/Dairy) |
| Periphery | Low-value, shelf-stable staples. | Kansas/Saskatchewan (Wheat/Grains) |
| Remote Periphery | Low-intensity grazing. | Wyoming/Texas (Beef Cattle) |
4. Why Regional Patterns Shift
Regional land use is dynamic. As a region’s population grows (like the American South or Southwest), the “market center” shifts. The model predicts that:
- Extensive land (ranching) will be converted to Intensive land (produce) to serve the new local population.
- The original “Extensive” producers will be pushed even further into the wilderness.
How does Von Thunen’s model make predictions on the national scale?
On a national scale, Von Thünen’s model expands from a local “market town” to treat an entire country as a single economic system.
At this level, the “Market Center” is represented by the nation’s primary industrial and population core (such as the BosWash Megalopolis in the US or the London-SE England corridor in the UK). The model predicts that the country will organize itself into massive macro-belts of specialized agriculture based on their distance from this national core.
1. The National “Core-Periphery” Structure
The model predicts a clear gradient of land use intensity across the national landscape:1
- The National Core (The “Inner Ring”): Regions immediately surrounding the country’s largest urban clusters. Here, land is most expensive. The model predicts these areas will focus on “Truck Farming” (fresh produce) and liquid milk production.
- Example: The high-density market gardens in New Jersey and the “milksheds” of upstate New York serving the US Northeast.
- The National Mid-Periphery: Regions with moderate land costs and good transport links. The model predicts these areas will produce bulkier, semi-perishable goods or products for processing.2
- Example: The “Dairy Belt” of the Upper Midwest (Wisconsin/Minnesota) which produces cheese and butter—products that are less perishable than liquid milk and can survive the journey to the coastal cores.3
- The National Periphery (The “Outer Rings”): Remote regions with the lowest land costs. The model predicts these will be dedicated to Extensive Grain Farming and Livestock Ranching.
- Example: The Wheat Belt of the Great Plains and the massive cattle ranches of the American West.
2. Infrastructure as the “National Distorter”
On a national scale, the “perfect rings” are rarely circular because the model predicts that transportation corridors act as funnels.
- Linear Ribbons: Agricultural intensity will “bleed” outward from the core along major interstate highways, rail lines, and navigable rivers (like the Mississippi). A farm 1,000 miles away on a direct rail line to the core may behave like a farm only 200 miles away.
- The “Cool Chain” Revolution: National-scale predictions must account for refrigerated transport. This allows high-value, perishable zones to exist in geographically distant but climatically “perfect” regions (like Florida’s citrus or California’s Central Valley), provided they have the infrastructure to reach the national market quickly.
3. Land Value and National Bid-Rent
The model predicts that the Land Value Gradient decreases as you move away from the national core.4 This has several national-scale consequences:
- Agricultural Abandonment: As the national core expands, the “Bid-Rent” for housing and industry becomes so high that agriculture is pushed further out. This explains why former farmland in the eastern US has reverted to forest or suburban sprawl.
- Specialization by Comparative Advantage: The model predicts that regions will stop trying to be self-sufficient and instead specialize in what is most profitable relative to their national distance.
Summary of National Scale Predictions
| Zone Type | Distance from National Core | Predicted Land Use | Economic Logic |
| Hinterland Core | 0–200 miles | Fresh vegetables, berries, liquid milk. | High perishability; high land value requires high turnover. |
| Intermediate Zone | 200–800 miles | Corn, soybeans, hogs, processed dairy. | Semi-perishable; bulkier transport costs. |
| Continental Interior | 800–2,000 miles | Wheat, barley, extensive grains. | Non-perishable; low land cost is vital for profit. |
| Frontier/Arid Zone | 2,000+ miles | Cattle ranching, sheep, wool. | Lowest land cost; animals “walk” to railheads or ports. |
4. Why National Patterns “Break”
Today, Von Thünen’s national-scale predictions are being overwritten by the Global Scale. Many nations no longer operate as “Isolated States.”
- Example: A country like the UK may not have a “Wheat Ring” because it is cheaper to import grain from the “Global Outer Ring” (Ukraine or Canada) than to grow it on expensive domestic land.
How does Von Thunen’s model make predictions on the international scale?
On an international or global scale, Von Thünen’s model treats the entire world as one giant “Isolated State.” In this macro-version of the theory, the Market Center is not a single city, but rather the Global Core—the highly urbanized, high-consumption regions of North America, Western Europe, and East Asia.
The model predicts that agricultural land use across the planet will organize into massive zones based on their distance (in terms of shipping time and cost) from these global consumption hubs.1
1. The Global “Inner Ring” (High-Value/Perishable)
The model predicts that countries located near the global core, or those with exceptionally fast transport links to it, will specialize in intensive, high-value, and perishable goods.2
- Regional Specialization: Countries like Mexico (serving the US) or the Mediterranean nations (serving Northern Europe) act as the “Global Market Gardens.” They provide fresh fruits, vegetables, and flowers that would spoil if transported from further away without expensive technology.
- The Seasonal Shift: Interestingly, the model predicts that the “Inner Ring” can shift seasonally. During the Northern Hemisphere’s winter, countries like Chile or South Africa become the “Global Inner Ring” for fruit, using high-speed air and sea freight to overcome the physical distance.
2. The Global “Middle Rings” (Bulk Commodities)
Further from the core, the model predicts zones of semi-perishable and bulk commodities. These are products that are easier to store and ship in massive quantities.
- Grain Belts: Regions like the Ukrainian Steppes, the Brazilian Cerrado, and the Argentinian Pampas serve as the “Global Breadbaskets.”
- Industrial Crops: Large-scale monocultures of soybeans, corn, and palm oil are grown in these middle rings where land is relatively cheap compared to the Global Core, but transport infrastructure (ports and rail) is developed enough to move bulk goods efficiently.
3. The Global “Outer Ring” (Extensive Livestock)
The model predicts that the most distant or “marginal” lands—those furthest from global shipping lanes or with the lowest land values—will be used for extensive livestock ranching.
- Example: The Australian Outback, the remote regions of Central Asia, and parts of the Amazon basin. In these areas, land is so inexpensive that ranchers can graze cattle or sheep over thousands of miles. The final product (meat or wool) is high-value and non-perishable enough to survive the long journey back to the Global Core.
4. How the “Global Scale” Distorts the Model
While the logic of the model holds, several factors “warp” the global rings:
| Factor | Effect on the Global Model |
| Containerization | Massive ships have made the cost of moving goods across oceans cheaper than moving them across land, effectively “pulling” distant coastal countries closer to the Market Center. |
| Trade Agreements | Tariffs and subsidies act as “artificial distance.” A country may be geographically close to a market but “economically far” because of high taxes on its goods. |
| The “Cool Chain” | Refrigerated shipping allows countries in the “Outer Ring” (like New Zealand) to behave like they are in the “Inner Ring” by shipping fresh lamb and dairy halfway across the world. |
Summary of Global Predictions
| Zone | Global Role | Representative Regions |
| Global Core | High-Consumption Market | USA, EU, China, Japan |
| Inner Ring | Fresh produce, flowers, dairy | Mexico, Mediterranean, Caribbean |
| Middle Ring | Grains, oilseeds, sugar | Ukraine, Brazil, USA Midwest |
| Outer Ring | Beef, wool, industrial timber | Australia, Argentina, New Zealand |
The Global Von Thünen model shows us that a supermarket in London is the “Center” for a grape farmer in Chile, a wheat farmer in Ukraine, and a sheep rancher in New Zealand.
Solved Problems
Part 1: Physical and Economic Factors
Q1: A farmer in a mountainous region chooses to graze goats rather than grow wheat. Which physical site characteristic is the primary factor?
- Solution: Topography (Relief). Steep slopes make mechanical wheat harvesting impossible, whereas goats are mobile and suited for rugged terrain.
Q2: A developer wants to build a subdivision on a “dry-point site” near a river. Why is this specific site characteristic valuable?
- Solution: A dry-point site is an area of slightly higher elevation in a landscape prone to flooding. It provides safety from water damage while maintaining proximity to the river’s resources.
Q3: Two farms have identical soil, but Farm A is located on a south-facing slope and Farm B on a north-facing slope in the Northern Hemisphere. Which will likely produce higher-value crops?
- Solution: Farm A. The “Aspect” (direction a slope faces) provides more direct sunlight and warmth, creating a better microclimate for high-value crops like grapes.
Q4: A country transitions from subsistence farming to commercial agribusiness. How does the “labor-to-capital ratio” change?
- Solution: The ratio decreases. Human labor (labor) is replaced by expensive machinery and technology (capital).
Q5: Apply the “Law of Diminishing Returns” to a farmer using fertilizer. When should the farmer stop adding more?
- Solution: The farmer should stop when the cost of the next unit of fertilizer exceeds the market value of the additional crop yield it produces (Marginal Cost > Marginal Revenue).
Part 2: Von Thünen’s Model (Theory & Logic)
Q6: According to Von Thünen, why is the “Forestry” ring located closer to the city than the “Wheat” ring?
- Solution: In the 1820s, wood was heavy and bulky. The transport cost per mile for wood was much higher than for grain, requiring it to be grown closer to the market to remain profitable.
Q7: If a new high-speed rail line is built through a Von Thünen landscape, how will the rings change shape?
- Solution: The rings will “warp” or extend outward along the rail line, creating a star-like pattern as distant land becomes effectively “closer” in terms of travel time and cost.
Q8: Using Bid-Rent Theory, explain why skyscrapers are found in city centers while cattle ranches are found in the countryside.
- Solution: Land at the center has the highest “Location Rent.” Only high-density, high-profit activities (like offices) can afford the “bid” for that land. Ranching requires massive space and generates low profit per acre, so it can only afford the cheapest land.
Q9: A city sees a massive population boom. What happens to the “first ring” of Von Thünen’s model?
- Solution: The ring expands outward. Increased demand for fresh food and higher land values push the intensive farming zone further into what was previously the grain or forest zones.
Part 3: Scales of Production
Q10: At a national scale, why is the U.S. “Corn Belt” located in the Midwest rather than right next to the massive cities of the East Coast?
- Solution: Corn is a bulk crop that is relatively non-perishable. The mid-range distance allows for cheaper land (extensive use) while modern rail systems keep transport costs low enough for it to reach the coastal markets.
Q11: How does “The Cool Chain” (refrigerated shipping) affect Von Thünen’s international scale predictions?
- Solution: It “shatters” the rings by allowing highly perishable items (like flowers from Kenya or blueberries from Peru) to be grown in the global “periphery” and sold in the global “core.”
Q12: In a Socialist Mode of Production, how are land-use decisions made compared to a Commercial Model?
- Solution: In the Socialist model, decisions are made by central government planners based on national quotas. In the Commercial model, decisions are made by individual farmers or corporations based on market price signals.
Q13: Why does “Peasant Mode” production often result in higher biodiversity on a single plot than “Commercial Mode”?
- Solution: Peasants use “Intercropping” (multiple crops in one field) to reduce the risk of total failure. Commercial models prioritize “Monoculture” for mechanical efficiency, which reduces biodiversity.
Part 4: Advanced Application
Q14: A remote island has no trade with the outside world. It has a central village and uniform land. Which model will its agriculture most likely resemble?
- Solution: Von Thünen’s “Isolated State.” Without external trade or geographic variation, land use will organize into concentric rings based purely on the effort required to carry food to the village.
Q15: Explain the “Socialist Paradox” where tiny private plots often outperformed massive collective farms.
- Solution: On private plots, farmers kept 100% of the benefit of their labor (incentive). On collective farms, the “Law of Diminishing Returns” on labor was felt more strongly because the individual’s extra effort didn’t significantly increase their personal reward.
Q16: A tropical country grows coffee for export to Europe. Is this a “Subsistence” or “Commercial” system? Is it “Intensive” or “Extensive”?
- Solution: It is Commercial (grown for profit/export) and Intensive (requires high labor for picking and high capital for processing on a relatively fixed plantation area).
Q17: How does “World Cultural Preference” affect the relative location of Vineyards?
- Solution: Cultural preference for wine creates high demand. This increases the “Bid-Rent” for land with the perfect “Site” (sunny slopes), allowing vineyards to outbid other uses even if they are located far from the city.
Q18: What is the “Relative Location” of a dairy farm in the 21st century compared to the 19th century?
- Solution: In the 19th century, its relative location had to be “within a few hours’ wagon ride” of a city. Today, its relative location is “within a day’s trucking distance,” which has greatly expanded the radius of the “Milkshed.”