The relationship between resources and the environment is interdependent and cyclical. In simplest terms, the environment acts as a “source” for everything we use and a “sink” for everything we discard.
This relationship is often explained through three primary lenses:
1. The Environment as a Source (Provisioning)1
The environment is the physical origin of all natural resources. These are categorized into:
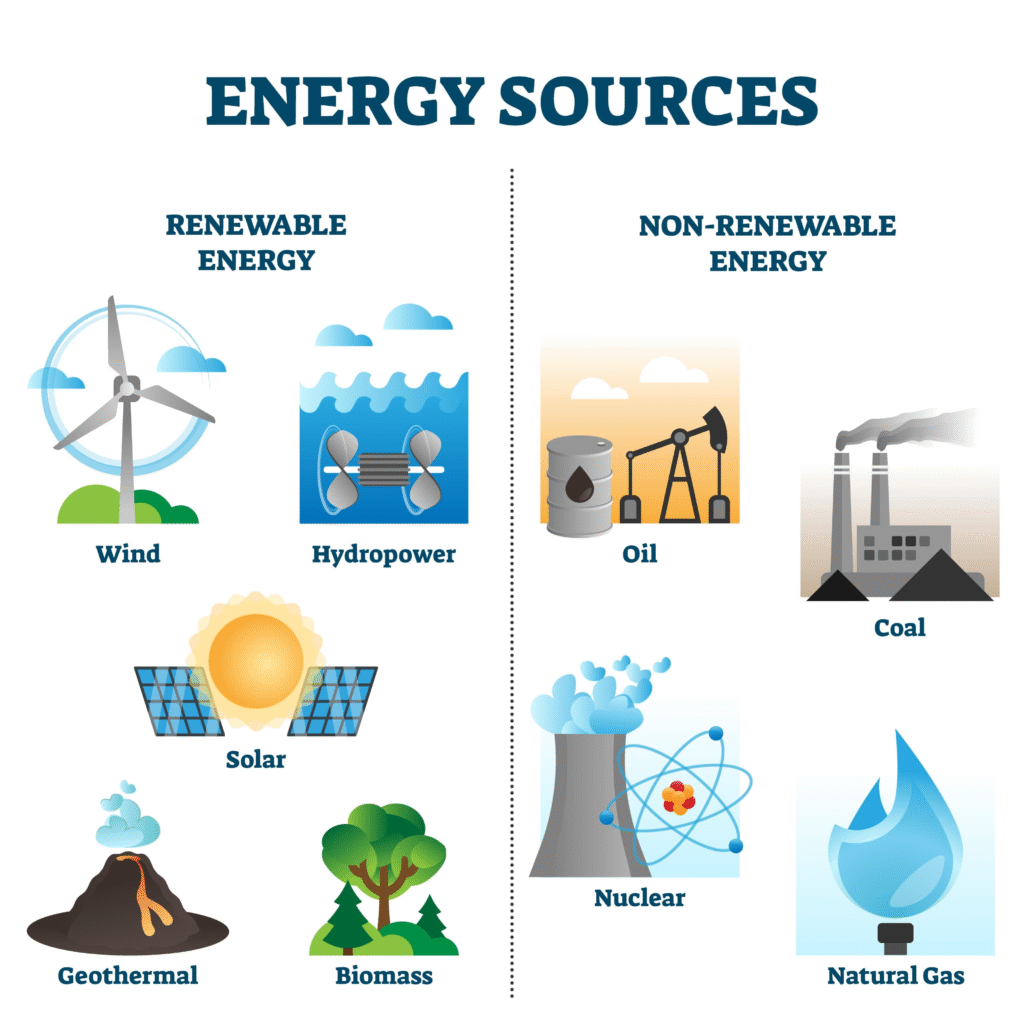
Renewable Resources: Materials that can replenish themselves over time, such as timber, solar energy, and freshwater.
Non-Renewable Resources: Materials that exist in finite amounts, such as fossil fuels (oil, coal) and minerals (gold, copper).2
Ecosystem Services: Beyond physical materials, the environment provides “services” like pollination, water purification by wetlands, and climate regulation through forests.3
2. The Environment as a Sink (Absorption)
Once resources are extracted, processed, and consumed, they return to the environment as waste.
Waste Absorption: The environment has a natural capacity to break down and absorb certain types of waste (e.g., bacteria decomposing organic matter).
Pollution: When the volume of waste (like plastic or $CO_2$) exceeds the environment’s “sink” capacity, it leads to pollution and environmental degradation.
3. The Feedback Loop
The way we use resources directly changes the health of the environment, which in turn affects the future availability of those resources. This creates a critical feedback loop:
Action
Environmental Impact
Consequence for Resources
Over-extraction
Habitat loss and soil erosion
Lower agricultural yields and species extinction.
Burning Fossil Fuels
Global warming and ocean acidification
Loss of coastal land and disrupted water cycles.
Sustainable Management
Ecosystem restoration
Long-term security of food, water, and energy.
Summary of the Relationship
The relationship is defined by Environmental Limits. There is a “critical point” where pressure on a resource creates irreversible damage to the system.4 For a stable relationship, the rate of resource consumption must not exceed the environment’s rate of replenishment, and the rate of waste production must not exceed the environment’s capacity to absorb it.
Sustainable Resource Management Strategies
This video provides a deep dive into how we can balance economic development with environmental protection through sustainable resource management.
What is the relationship between population and environment?
The relationship between population and the environment is a dynamic interaction where human numbers, lifestyles, and technologies determine the pressure placed on the Earth’s natural systems. This relationship is often described through the concepts of carrying capacity and impact equations.1
1. The IPAT Equation: Measuring Impact2
To understand how population affects the environment, scientists use the IPAT equation.3 It demonstrates that the number of people is only one part of the story; how those people live and the technology they use are equally critical.4
I = P x A x T
I (Impact): The total environmental degradation or resource depletion.5
P (Population): The number of people in a given area.6
A (Affluence): The average consumption per person (often measured by GDP per capita).7
T (Technology): The resource intensity used to produce that affluence (e.g., carbon-heavy coal vs. clean solar energy).8
Key Takeaway: A small population with high affluence and “dirty” technology can have a much larger environmental footprint than a large, low-consumption population.
2. Carrying Capacity and Limits to Growth
The environment has a carrying capacity—the maximum population size it can sustain indefinitely without degrading its own ability to support life in the future.9
Shutterstock
Overshoot: When a population exceeds the carrying capacity, it is in “overshoot.”10 This leads to resource depletion (e.g., overfishing, soil exhaustion) and a subsequent decline in the population’s well-being.
The Malthusian Trap: Thomas Malthus famously argued that population grows exponentially while food production grows only linearly, eventually leading to famine and “catastrophe.”11 While technology (like the Green Revolution) has pushed these limits further than Malthus predicted, the physical limits of land and water remain.
3. Key Pressure Points
As population grows and density increases, the environment experiences pressure in three main areas:12
Area of Impact
Consequence of Growth
Land Use
Urban sprawl and agriculture lead to habitat fragmentation and the loss of biodiversity.
Pollution
Higher concentrations of waste (plastic, sewage, CO2) often exceed the environment’s “sink” capacity to absorb them.
Resource Scarcity
Intense demand for freshwater, minerals, and fertile soil can lead to permanent depletion of non-renewable resources.
4. The Role of Population Density
Density acts as a “multiplier.”13 In cities, high density can lead to concentrated pollution (smog, water contamination) but can also allow for efficiency gains through public transit, shared infrastructure, and smaller living spaces, potentially lowering the per-capita environmental impact compared to low-density suburban sprawl.14
What is the relationship between carrying capacity and overpopulation?
The relationship between carrying capacity and overpopulation is one of a threshold and its violation. In ecology, carrying capacity is the “limit,” and overpopulation is what happens when that limit is crossed.1
1. The Core Relationship: Limit vs. State
Carrying Capacity (2$K$): This is the maximum number of individuals of a specific species that an environment can support sustainably (indefinitely) without degrading the resource base.3 It is determined by “limiting factors” like food, water, space, and the environment’s ability to absorb waste.4
Overpopulation: This is the state where the actual population (5$N$) exceeds the carrying capacity (6$K$).7 It is not just about having “a lot” of people or animals; it is specifically about having more than the local resources can replenish.8
2. The Mechanics of “Overshoot”
When a population grows beyond its carrying capacity, it enters a phase called overshoot.9 The relationship between the two then shifts from growth to degradation:
Resource Depletion: Because the population is larger than the “budget” of the environment, it begins “eating into the principal.”10 For example, instead of just eating the fruit a forest produces, an overpopulated species might start eating the trees themselves.
Lowering the Future Capacity: Paradoxically, overpopulation often lowers the original carrying capacity. By over-consuming resources or polluting the “sink,” the environment becomes less productive, meaning it can support even fewer individuals in the future.
The Die-Back: In nature, overshoot is almost always followed by a “die-back” or crash.11 As resources become scarce, the death rate rises and the birth rate drops until the population falls back below the (now likely lower) carrying capacity.12
3. Human Carrying Capacity: A Moving Target
For humans, the relationship is more complex because of Technology (13$T$) and Affluence (14$A$).15
Expansion: Unlike other animals, humans can artificially increase their carrying capacity through innovation (e.g., the Green Revolution, desalination, or vertical farming).
Earth Overshoot Day: Despite these innovations, global data for 2025 suggests we are living in a state of global overpopulation relative to the planet’s biocapacity.16Note: “Earth Overshoot Day” in 2025 fell on July 24.17 This means that by late July, humanity had used all the ecological resources and services that Earth can regenerate in that entire year.
Summary Comparison
Feature
Carrying Capacity (K)
Overpopulation (N>K)
Definition
The “Sustainable Ceiling”
The “Broken Ceiling”
Resource Status
Resources regenerate at the rate they are used.
Resources are depleted faster than they can recover.
Environmental Health
Stable and balanced.
Degraded (pollution, erosion, loss of biodiversity).
Long-term Result
Stability/Equilibrium.
Population crash or forced migration.18
What is the relationship between optimum population and the quality of life?
The relationship between optimum population and the quality of life is defined by a “sweet spot” where the number of people perfectly balances with available resources and technology to produce the highest possible standard of living.1
In this relationship, the quality of life is not a fixed number; it is a variable that reaches its peak only when the population size matches the environment’s ability to provide.
1. The Inverted U-Curve Relationship2
The relationship is typically visualized as an inverted U-shaped curve.3 On this graph, the quality of life (often measured by per capita income, health, or welfare) rises as population grows, hits a maximum point, and then begins to decline.4
Underpopulation Stage: In this stage, a region has too few people to fully exploit its resources.5 Infrastructure (like roads and hospitals) is expensive to maintain for a small group, and there isn’t enough labor for specialized industries. Increasing the population here actually improves the quality of life.
Optimum Population Point: This is the peak of the curve.6 Here, the ratio of people to resources creates the maximum “Economic Welfare.”7 Everyone has the best possible access to food, energy, housing, and social services.
Overpopulation Stage: Once the optimum point is passed, adding more people begins to “dilute” the quality of life.8 Resources are stretched thin, leading to lower wages, crowded housing, and environmental degradation.
2. Indicators of an “Optimum” Quality of Life
When a population is at its optimum, it manifests in several key indicators:
Indicator
At the Optimum Level
In Overpopulation
Per Capita Income
Reaches its highest possible point.
Declines as resources are shared by too many.
Employment
High productivity with low unemployment.
Underemployment or extreme job competition.
Public Services
Schools and clinics meet public demand.
Overburdened systems; long wait times.
Environment
Sustainable resource use; low pollution.
High waste levels; “sink” capacity exceeded.
Personal Space
Adequate housing and wild nature access.
Overcrowding; loss of biodiversity.9
3. The “Dynamic” Nature of the Relationship
The optimum population is a moving target because the “Quality of Life” can be artificially boosted or lowered by two external factors:
Technology (10$T$): If a society develops better technology (e.g., more efficient farming, AI, or renewable energy), its optimum population point moves upward.11 The country can now support more people at the same—or higher—quality of life.
Resource Discovery/Depletion: Finding new resources (like a major mineral deposit) raises the optimum point. Conversely, resource exhaustion or climate change can lower the optimum, making a previously stable population suddenly “overpopulated.”12
4. Qualitative vs. Quantitative Well-being
Modern research, such as the SNQ model (Sustainability, Nature, Quality of life), argues that quality of life isn’t just about money.13 For a population to be truly optimal, it must be:
Large enough for cultural vibrancy and economic specialization.14
Small enough for social dynamics and the environment to remain on a “human scale.”15
Key takeaway: A population is “optimal” only if it can provide a high quality of life sustainably. If a high standard of living is achieved by depleting non-renewable resources, it is not a true optimum because it is “borrowing” the quality of life from future generations.
What types of resources are there and do they have any limits?
Resources are generally categorized based on their origin, exhaustibility, and level of development.1 While we often think of “renewable” as meaning “unlimited,” almost every resource on Earth has a specific type of limit—whether it is a limit of quantity, time, or the environment’s ability to handle its use.
1. Classification by Exhaustibility
This is the most common way to categorize resources, focusing on how quickly they replenish.
Non-Renewable Resources (Exhaustible): These exist in fixed quantities and take millions of years to form.2 Once used, they are gone for good on a human timescale.3
Limits:Absolute quantity.5 There is a finite amount of “stock” in the Earth’s crust.
Renewable Resources (Replenishable): These can be reproduced by physical, chemical, or mechanical processes.6
Examples: Solar energy, wind, and water.
Limits:Flow and Rate. While the sun won’t “run out,” the amount of energy we can capture at any one moment is limited.7 For resources like timber or fish, the limit is the Rate of Regeneration; if we harvest faster than they grow, they become effectively non-renewable.8
Flow Resources: A subset of renewables that do not stay in one place and must be used where and when they occur.
Examples: Running water, wind, and tides.
Limits:Spatial and Temporal. You can’t “store” a wind breeze for later without converting it to another form (like a battery), and you can only harness it where the wind is blowing.
2. Classification by Origin
Biotic Resources: Derived from living or organic matter.9
Examples: Forests, crops, birds, and fish.10
Limits: Susceptible to Ecological Collapse. If the ecosystem supporting them is damaged (e.g., through pollution), the resource can disappear entirely.
Abiotic Resources: Composed of non-living things.11
Examples: Land, water, air, and ores.12
Limits:Quality Degradation. While we won’t “run out” of air, we can run out of breathable air.
3. Classification by Status of Development
This looks at our access to resources rather than just their existence.
Type
Description
The “Limit”
Potential Resources
Known to exist but not yet fully utilized (e.g., solar potential in a desert).
Technology & Cost. We know they are there, but we can’t afford or don’t have the tech to get them yet.
Developed Resources
Surveyed and quantified for current use.
Infrastructure. Limited by the pipes, wires, and mines we have already built.
Stock
Materials that could satisfy needs, but we lack the technology to use them (e.g., hydrogen from water).
Human Knowledge. Limited by our current scientific understanding.
Reserves
A subset of “Stock” that can be used with existing tech but is being saved for the future.
Political/Strategic Will. Limited by our choice to save them for later.
The Ultimate Limit: Planetary Boundaries
Even “unlimited” resources have a final limit: the Planetary Boundary. This is the limit of the Earth’s “sink” capacity. For example, we might have enough coal to burn for 100 more years (Quantity Limit), but the atmosphere cannot absorb that much $CO_2$ without triggering catastrophic climate change (Environmental Limit).
Renewable, Non-Renewable, and Flow Resources
This video provides a clear visual breakdown of how different resource types are connected to Earth’s physical features and why protecting them is essential for sustainability.
What is the relationship between resources and reserves?
The relationship between resources and reserves is best understood as a “subset” relationship. While people often use the terms interchangeably, in geology and economics, they represent very different levels of confidence and viability.1
The simplest rule to remember is: Every reserve is a resource, but not every resource is a reserve.2
1. The Core Definitions
Resources: The total amount of a material (like oil, coal, or gold) that exists in the Earth’s crust in a form that is potentially extractable.3 This includes deposits we haven’t found yet or those that are currently too expensive to mine.
Reserves: The specific portion of a discovered resource that can be legally, technically, and economically extracted at a profit right now, using today’s technology and current market prices.4
2. The McKelvey Box (The Resource Matrix)
Geologists use a diagram called the McKelvey Box to visualize this relationship.5 It categorizes materials based on two axes: Geological Certainty (horizontal) and Economic Feasibility (vertical).6
Top-Left Corner (Reserves): This is the “gold standard.” These are materials we are sure exist and know we can make money from today.7
Bottom-Left (Subeconomic Resources): We know they are there, but it would cost more to get them out than they are worth.
Right Side (Undiscovered Resources): These are based on geological theory. We think they are there, but we haven’t drilled or surveyed enough to prove it.
3. A Dynamic Relationship
The boundary between a resource and a reserve is fluid.8 A material can “move” from being just a resource to becoming a reserve based on three main “triggers”:
Trigger
How it changes the relationship
Example
Price Increase
As the market price of a mineral goes up, deposits that were “too expensive” suddenly become profitable.
Gold prices rise, making a low-grade mine profitable.
New Technology
Better machinery or chemical processes can lower the cost of extraction.
Fracking turned deep shale gas from a “resource” into a massive “reserve.”
Exploration
Drilling and surveying turn “undiscovered resources” into “identified resources.”
A mining company discovers a new vein of copper via satellite mapping.
4. Why the Distinction Matters
This distinction is crucial for global planning and the stock market.
Sustainability: If a politician says we have “100 years of coal left,” they are usually talking about reserves. The total resource might last 500 years, but we can’t count on it until the tech or price makes it accessible.
Investment: Mining companies are valued based on their Proven Reserves, not just the total amount of rock they own, because reserves represent guaranteed future income.9
What is the relationship between renewable and nonrenewable resources?
The relationship between renewable and non-renewable resources is best understood as a transition from finite stock to infinite flow.1 While they are often viewed as opposites, they currently function as a single, interconnected global energy and material system.
1. The Core Functional Difference
The primary distinction lies in the timescale of replenishment compared to the rate of consumption.2
Non-Renewable (Finite Stock): These are resources that take millions of years to form (like fossil fuels) or are present in fixed amounts (like minerals).3 We are consuming them billions of times faster than they can regenerate.4
Renewable (Natural Flow): These are resources that replenish themselves on a human timescale—daily (solar), seasonally (timber), or perpetually (tides).
2. The Relationship of Interdependence
In the modern world, these two types of resources do not exist in isolation. They are deeply linked in three ways:
The “Bootstrap” Relationship: We currently use non-renewable resources to build renewable infrastructure. For example, it takes coal-fired steel and mined lithium/copper (non-renewable) to create wind turbines and EV batteries (renewable).
Grid Balancing: Because renewables like solar and wind are “intermittent” (they only work when the sun shines or wind blows), many power grids use non-renewables like natural gas as a “backup” to ensure constant electricity.5
The Economic Shift: As non-renewable reserves become harder and more expensive to extract, the “cost-competitiveness” of renewables increases. This creates a market pressure where renewables gradually replace non-renewables.
3. Key Comparison: Source vs. Impact
While both are natural resources, their relationship with the environment is vastly different:
Feature
Non-Renewable
Renewable
Origin
Ancient biological/geological matter
Continuous natural processes
Sustainability
Depletable (it will eventually run out)
Inexhaustible (if managed properly)
Carbon Impact
High $CO_2$ emissions (operation phase)
Low to zero emissions (operation phase)
Primary Limit
Physical quantity in the Earth
Technology for capture and storage
4. The Bridge: Transition Resources
Certain resources act as a “middle ground.” For example, Biomass (wood/organic waste) is renewable because we can grow more trees, but if we burn it faster than it grows, it behaves like a non-renewable resource. Similarly, Nuclear energy is non-renewable (uranium is finite) but is often grouped with renewables because it provides “clean” (low-carbon) power.6
Key takeaway: The goal of modern sustainability is to move the relationship from one of dependency on non-renewables to one where renewables provide the power, and non-renewables (like minerals) are strictly recycled in a circular economy.
Renewable vs Non-Renewable Resources: Key Differences Explained
This video provides a clear visual breakdown of how different resource types are connected to Earth’s physical features and why protecting them is essential for sustainability.
Are there limits to natural resources?
Yes, there are absolute and practical limits to natural resources. These limits are defined not just by how much of a material is left in the ground, but by how much pressure the Earth’s systems can handle before they stop functioning.1
As of 2025, scientific data shows we have already pushed past several of these critical thresholds.2
1. The Nine Planetary Boundaries (2025 Update)3
The most significant way scientists define “limits” is through the Planetary Boundaries framework. This identifies nine systems that keep Earth stable.4 When we use resources (like land, water, or fossil fuels) too aggressively, we breach these boundaries.
According to the Planetary Health Check 2025, we have now breached seven of the nine boundaries:5
Climate Change: Too much 6$CO_2$ from fossil fuel resources.7
Biosphere Integrity: Loss of biodiversity and extinction of species.8
Land System Change: Converting too many forests into farms.
Freshwater Use: Taking more water than the cycle can replenish.
Biogeochemical Flows: Overuse of nitrogen and phosphorus in fertilizers.9
Novel Entities: Introduction of plastics and chemicals into the environment.10
Ocean Acidification: (New in 2025) Oceans are becoming too acidic to support coral and shellfish.11
2. Limits to Non-Renewable Resources
For resources like minerals, metals, and fossil fuels, the limit is Physical Quantity.
Finite Stock: There is only a certain amount of copper, gold, or oil in the Earth’s crust.
Economic Limit: We may never “run out” of a mineral entirely, but we reach a point where it takes more energy and money to mine it than the resource is worth. This is often called “Peak Resource.”
3. Limits to Renewable Resources
A common misconception is that renewables are “unlimited.” While the source (the sun or wind) may be infinite, the resource’s availability is limited by:
Rate of Regeneration: If we cut down trees or catch fish faster than they can reproduce, we turn a renewable resource into a vanishing one.12 This is known as Overexploitation.
Material Constraints: Building “limitless” solar and wind power requires massive amounts of lithium, cobalt, and silver—non-renewable minerals that have their own strict limits.
4. The “Sink” Limit: The Ultimate Boundary
The most dangerous limit is not how much we can take (the Source), but how much waste the environment can absorb (the Sink).
Example: We might have enough coal to last another century, but we cannot burn it because the atmosphere’s “limit” for carbon has already been reached.
Earth Overshoot Day: This is the date each year when humanity has used all the biological resources the planet can regenerate for that year. In 2025, that date fell on July 24, meaning for the rest of the year, we were “operating in the red.”
Summary of Resource Limits
Resource Type
Primary Limit
Consequence of Exceeding
Fossil Fuels
Atmospheric capacity ($CO_2$ levels)
Global warming and extreme weather.
Freshwater
Annual rainfall and aquifer recharge
Droughts and “Day Zero” water crises.
Minerals
Purity and extraction cost
Skyrocketing prices and supply chain failures.
Soil
Rate of nutrient replenishment
Famine and loss of agricultural land.
What are renewable resources?
Renewable resources are natural substances or energy sources that replenish themselves naturally over time at a rate equal to or faster than they are consumed by humans.1
Unlike non-renewable resources (such as coal or oil), which take millions of years to form and exist in fixed amounts, renewable resources are considered inexhaustible or sustainable on a human timescale.2
1. Types of Renewable Resources
Most renewable resources are driven by the Earth’s natural cycles (the water cycle, the sun’s radiation, and the wind).3
Resource
Source
How it works
Solar
The Sun
Captures sunlight using photovoltaic (PV) cells to create electricity or thermal panels for heat.
Wind
Air Currents
Uses the kinetic energy of moving air to spin turbines that generate power.
Hydropower
Moving Water
Harnesses energy from flowing rivers or falling water in dams to turn generators.
Biomass
Organic Matter
Energy from plants, wood, and waste that is burned or converted into liquid fuels (biofuels).
Geothermal
Earth’s Heat
Taps into the steam or hot water from deep underground to heat buildings or generate electricity.
Marine
Tides & Waves
Uses the predictable movement of ocean tides and waves to create energy.
2. Is Every Renewable Resource “Unlimited”?
While the source (like the sun) might be infinite, our ability to use the resource often has practical limits:
The Regeneration Trap: Biological resources like timber and fish are renewable only if we harvest them slower than they can grow back. If we cut down a forest faster than it can regrow, it becomes a “depleting” resource.
Geographic Dependency: You cannot harness geothermal energy effectively everywhere; it is limited to “hot spots” like Iceland or parts of the western U.S.
Intermittency: Solar and wind are variable—the sun doesn’t always shine, and the wind doesn’t always blow.4 This requires energy storage (batteries) to make them reliable.
3. The Relationship with “Clean” Energy
People often use “renewable” and “clean” interchangeably, but there are subtle differences:5
Renewable: Focuses on the supply (it won’t run out).6
Clean/Green: Focuses on the impact (it doesn’t pollute).7
Example: Large-scale Hydropower is renewable, but it may not always be considered “green” if the dam destroys local ecosystems and displaces wildlife. Similarly, Biomass is renewable, but burning wood still releases $CO_2$ into the atmosphere.
4. Why They Matter in 2025
As of 2025, the transition to renewables is no longer just an environmental choice but an economic one.8
Cost: In most parts of the world, building new solar and wind farms is now cheaper than running existing coal or gas plants.9
Energy Security: Because renewables can be produced locally (rooftop solar, local wind), countries can reduce their dependence on imported fuels from other nations.10
What are nonrenewable resources?
Non-renewable resources are natural substances that exist in a fixed, finite amount.1 They cannot be replenished or replaced by natural means at a pace fast enough to keep up with human consumption.2
On a human timescale, once these resources are used, they are effectively gone forever because their natural formation takes millions of years.3
1. The Four Major Categories
Non-renewable resources are generally divided into two groups: fossil fuels and minerals/nuclear fuels.4
Resource Type
Examples
Primary Use
Fossil Fuels
Coal, Oil (Petroleum), Natural Gas
Electricity, transportation, heating, and plastics.
Nuclear Fuels
Uranium, Thorium
High-output, low-carbon electricity generation.
Metallic Minerals
Iron, Copper, Gold, Aluminum
Construction, electronics, and manufacturing.
Non-Metallic Minerals
Phosphorus, Salt, Sand, Gypsum
Agriculture (fertilizers) and building materials.
2. How They Are Formed
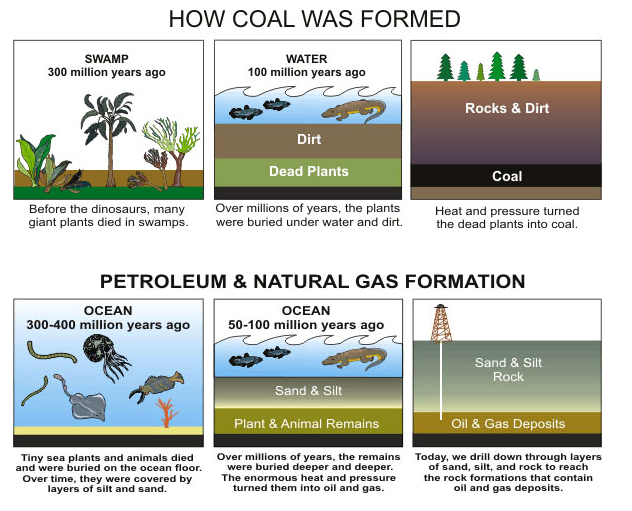
The formation of non-renewable resources is a slow, geological process involving extreme heat and pressure over “deep time.”5
Coal: Formed from the remains of ancient trees and plants in swamps that were buried by sediment 300–400 million years ago.6
Oil and Gas: Formed from microscopic marine organisms (plankton and algae) that sank to the ocean floor and were cooked by the Earth’s internal heat over millions of years.7
Minerals: Created through volcanic activity, tectonic plate movements, or the cooling of molten rock (magma) deep within the Earth.
3. The “Recyclable” vs. “Non-Recyclable” Distinction
Not all non-renewables disappear in the same way.
Non-Recyclable (Energy Resources): When we burn coal, oil, or gas, the energy is released as heat, and the material is converted into waste gases like $CO_2$. It cannot be “un-burned.”
Recyclable (Material Resources): While we cannot grow more iron or copper, we can melt down an old car and use the metal again. These are still non-renewable because the “stock” in the Earth is finite, but recycling extends their lifespan.8
4. Major Drawbacks
Because they are finite and carbon-based, the use of these resources carries significant risks:9
Economic Scarcity: As the “easy” deposits are used up, it becomes more expensive and energy-intensive to extract what remains (e.g., deep-sea drilling or fracking).
Environmental Impact: Burning fossil fuels is the primary driver of climate change due to greenhouse gas emissions.10 Mining can also lead to habitat destruction and water toxicosis.11
Geopolitical Conflict: Since these resources are only found in specific locations, their control often leads to international tension and war.
What are food resources?
Food resources are the biological materials—derived from plants, animals, and other organisms—that humans and animals ingest to obtain the energy and nutrients required for growth, health, and survival.1
In the context of the environment and population, food resources are not just “what we eat,” but the entire system of land, water, and biological diversity that makes eating possible.
1. Classification of Food Resources
The majority of the world’s food comes from four main “pillars” of production:
Agricultural Crops: Traditional land-based farming. Out of roughly 250,000 plant species, only about 3,000 are used for food, and just 20 species (like wheat, rice, and maize) provide 80% of the world’s food energy.
Livestock: Domesticated animals (cattle, sheep, poultry, pigs) that provide meat, dairy, and eggs. Livestock are “ruminants” that convert indigestible plant matter (cellulose) into high-quality protein for humans.
Fisheries and Aquaculture: Food from the water. This includes “capture fisheries” (wild-caught) and “aquaculture” (farmed fish like salmon or tilapia).
Wild Resources: Foraged plants, fungi (mushrooms), and hunted game.2 While a smaller portion of the global diet, these are critical for the food security of many indigenous and rural communities.
2. The Population-Food Connection
The relationship between population and food resources is a delicate balance of Food Security, which is built on four pillars:3
Availability: Is there enough food being produced?
Access: Can people afford to buy it or have the land to grow it?
Utilization: Is the food nutritious and safe to eat?
Stability: Is the supply reliable even during droughts or wars?
The 2025 Reality: As of late 2025, global food production is technically sufficient to feed the population, yet over 295 million people are facing acute hunger.4 This is often due to “Access” and “Stability” issues—conflict and economic shocks—rather than a total lack of “Availability.”5
3. Environmental Limits of Food Resources
Agriculture is the human activity with the single largest impact on the environment. The limits to our food resources are defined by:
Land Degradation: Over-farming and heavy pesticide use lead to soil erosion and loss of fertility.6
Water Scarcity: Agriculture consumes roughly 70% of the world’s freshwater.7 In many regions, we are pumping groundwater faster than rain can refill it.
Climate Change: Rising temperatures and extreme weather (floods/droughts) are currently “wiping out” harvests and reducing the nutritional value of crops like rice and wheat.8
The Energy Intensity: Modern food resources are often “subsidized” by non-renewable resources. It takes significant amounts of fossil fuels to produce fertilizers, run tractors, and transport food globally.
Impact Category
Statistic
Greenhouse Gases
Food systems cause 21%–37% of global emissions.
Deforestation
75% of global deforestation is tied to agricultural expansion.
Biodiversity9
Farming is the leading threat to 86% of species at risk of extinction.10
4. Future Trends: The “New” Food Resources
To stay within the Planetary Boundaries, the definition of food resources is expanding in 2025 to include:
Alternative Proteins: Plant-based meats, insect protein, and lab-grown (cultured) meat.
Vertical Farming: Growing crops in stacked layers indoors to save water and land.
Climate-Resilient Seeds: Genetically improved varieties that can grow in saltier soil or with less water.
What is nutritional quality of life?
Nutritional quality of life (NQoL) is a multidimensional concept that describes how a person’s diet and nutritional status influence their physical health, mental well-being, and social satisfaction.1
While “nutritional status” is a medical measurement of nutrients in your body, “nutritional quality of life” is a broader, more subjective measure of how food makes you feel and function on a daily basis.
1. The Three Dimensions of NQoL
The relationship between nutrition and quality of life is divided into three primary categories:
Physical (Functional Status): This is the most direct link. Proper nutrition provides the energy needed for Activities of Daily Living (ADLs).2
High NQoL: Having the strength to walk, shop, and cook independently.
Low NQoL: Malnutrition leading to muscle loss (sarcopenia), fatigue, and a higher risk of falls or illness.
Psychological (Mental Well-being): Food has a powerful effect on mood and cognitive clarity.3
High NQoL: Enjoying the taste and sensory pleasure of food; feeling mentally sharp due to stable blood sugar and brain-boosting nutrients (like Omega-3s).
Low NQoL: Anxiety over food access, the “brain fog” of a poor diet, or the loss of appetite and enjoyment in eating (anorexia of aging).
Social (Connectedness): Eating is one of the most fundamental social activities in human culture.
High NQoL: Frequently sharing meals with family or friends, which provides structure, a sense of belonging, and a reason to eat well.
Low NQoL: Social isolation or “eating alone,” which is a major risk factor for poor nutrition and depression, especially in older adults.
2. The Cycle of Nutrition and Quality of Life
The relationship is recursive, meaning they constantly feed into each other. This creates either a “virtuous cycle” or a “vicious cycle.”
The Virtuous Cycle
The Vicious Cycle
Good Nutrition leads to high energy and health.
Poor Nutrition causes fatigue and weakness.
High energy allows for Social Engagement.
Weakness leads to Social Isolation.
Social engagement encourages Regular Eating.
Isolation leads to Skipping Meals.
Result: Improved Quality of Life.
Result: Declining Quality of Life.
3. Key Indicators of High NQoL
To determine if someone has a high nutritional quality of life, experts look for more than just a “balanced plate.” They look for:
Dietary Diversity: Eating a wide variety of colorful, nutrient-dense foods rather than just the same few processed items.
Food Literacy: Having the knowledge and skills to choose, shop for, and prepare healthy meals.
Independence: The physical ability to procure and prepare one’s own food.
Sensory Enjoyment: The ability to taste and smell food, which naturally declines with age but can be managed.4
4. Why it Matters in 2025
As of 2025, NQoL is increasingly used as a clinical outcome in healthcare. Doctors no longer just ask “Are you eating?” but “How is your relationship with food affecting your happiness?” High NQoL is now recognized as a key tool for “Healthy Aging,” helping people live longer lives with fewer years spent in disability.
What are the causes of the food problem?
The “food problem” is rarely caused by a single factor.1 Instead, it is the result of a “perfect storm” where several global pressures collide. As of late 2025, the world is producing enough food to feed everyone, yet acute food insecurity has more than doubled since 2020, reaching over 295 million people.2
The causes can be categorized into four primary drivers:
1. Conflict and Geopolitical Instability3
Conflict remains the number one cause of hunger globally.4
Production Disruption: War prevents farmers from planting or harvesting crops and destroys vital infrastructure like irrigation and storage.5
Supply Chain Blockades: Conflict in “breadbasket” regions (like Ukraine or Sudan) restricts the export of staple grains and fertilizers to the rest of the world.6
Weaponization of Food: In several current crises, humanitarian access is restricted, and food is intentionally used as a lever of power.
2. Climate Chaos and Environmental Degradation7
In 2025, the climate crisis has shifted from an “occasional threat” to a “constant reality” for food systems.8
Extreme Weather: Heatwaves, unseasonable floods (like those seen in China and Western Europe this year), and multi-year droughts (like in the Horn of Africa) are flatlining crop yields.9
“Global Weirding”: Rapidly fluctuating rainfall patterns make it nearly impossible for farmers to predict planting seasons.10
Land Degradation: Over-farming and deforestation have led to massive soil erosion.11 According to recent reports, agricultural expansion is responsible for nearly 90% of global deforestation.12
3. Economic Shocks and Inflation
Even when food is available, it is increasingly unaffordable.13
Food Price Inflation: Since 2020, food prices have consistently risen faster than general inflation.14 In some low-income countries, food inflation has peaked as high as 30%.15
Input Costs: The high cost of fuel and fertilizer makes it expensive for small-scale farmers to grow food, forcing many to produce less or go out of business.16
Poverty and Inequality: The wealthiest 30% of the world generates 70% of food-related environmental impacts, while the poorest 10% often cannot afford even a basic healthy diet.
4. Structural Weaknesses and Policy Gaps
The way the global food system is built creates inherent vulnerabilities:
Waste: Roughly one-third of all food produced globally is lost or wasted before it ever reaches a plate.17
Funding Cuts: In 2025, humanitarian aid budgets have dropped significantly just as needs have spiked, leaving a massive gap in emergency food assistance.18
Lack of Diversity: The global diet relies on just a few crops (wheat, rice, maize).19 If a disease or weather event hits one of these “staples,” the entire global supply chain vibrates.
Summary of Primary Drivers (2025 Data)
Driver
Impact Level
Primary Consequence
Conflict
Highest
Forced displacement and total loss of access to markets.
Climate
Accelerating
Reduced nutritional value and unpredictable harvests.
High post-harvest losses and inefficient distribution.
How can humanity increase food production?
To increase food production for a growing population while staying within planetary limits, humanity is moving away from simply “clearing more land” toward sustainable intensification.
As of late 2025, the strategy focuses on producing more food from existing land using high-tech precision, biological breakthroughs, and a massive reduction in waste.
1. High-Tech Precision Agriculture
The “Digital Revolution” in farming uses data to maximize every square inch of soil.1
AI-Powered Management: By late 2025, over 60% of large-scale farms use AI to analyze satellite imagery and soil sensors.2 This allows for “Variable Rate Application,” where water and fertilizer are delivered only to the specific plants that need them, reducing waste by up to 40%.
Autonomous Robotics: “Self-driving” tractors and robotic weeders (which zap weeds with lasers or pull them) reduce the need for heavy chemical herbicides and solve labor shortages.3
Drones: Used for “early warning systems,” drones can spot a pest infestation in a single corner of a field before it spreads, preventing total crop loss.
2. Biological and Genetic Innovations
Instead of just changing the environment to suit the plants, we are changing the plants to thrive in a harsher environment.
CRISPR Gene Editing: Unlike older GMOs, CRISPR allows scientists to make “precise snips” to a plant’s own DNA.4 In 2025, we are seeing the rollout of heat-resilient maize and salt-tolerant rice that can grow in soil flooded by seawater.
The “Lightning” Nitrogen Fixation: New technologies mimic lightning strikes to create “green nitrogen” fertilizer from air and water using renewable energy, bypassing the carbon-heavy industrial processes traditionally used.5
Mycorrhizal Fungi: Scientists are “re-wilding” soil by adding beneficial fungi that attach to plant roots, helping them absorb nutrients and water more efficiently while locking carbon underground.6
3. Decoupling Food from Land
One of the most radical shifts is producing food without using traditional farmland at all.
Vertical Farming: Growing leafy greens and berries in stacked layers inside urban “factories.”7 This uses 95% less water than traditional farming and provides fresh food to cities year-round, independent of weather.
Cultivated (Lab-Grown) Meat: By late 2025, cultivated meat is moving from expensive prototypes to “hybrid” products (mixing plant protein with lab-grown animal cells) to lower costs and reduce the massive land footprint of livestock.
Precision Fermentation: Using microbes (like yeast) to “brew” milk proteins or egg whites in vats, providing high-quality protein without the need for cows or chickens.8
4. Structural Shifts (The “Low-Tech” Heroes)
Not all solutions involve high technology; some of the most effective methods are about better management:
Reducing Food Loss and Waste: Currently, one-third of all food produced is wasted. Improving cold-storage in developing nations and “streamlining” expiration labels in wealthy ones could feed an extra billion people without planting a single new seed.
Regenerative Agriculture: Returning to “ancient” wisdom like crop rotation, cover cropping, and no-till farming to rebuild soil health.9 Healthy soil holds more water, making crops more resilient to the droughts that have plagued 2025.
Alternative Proteins: Shifting global diets toward more plant-based proteins (beans, lentils) which require significantly less land and water per gram of protein than beef.
Summary: The Efficiency Gain
Strategy
Goal
Key 2025 Technology
Precision Ag
Reduce Inputs
AI, IoT Sensors, and Drones
Gene Editing
Climate Resilience
CRISPR-Cas9
New Frontiers
Land Independence
Vertical Farming & Cultivated Meat
Soil Health
Carbon Storage
Regenerative “No-Till” Farming
How can we create new food supplies and sources?
Creating new food supplies in 2025 involves moving beyond traditional soil-and-sun agriculture toward “cellular” and “circular” systems. We are essentially expanding the definition of what can be a “food source” by using technology to bypass the limitations of land and climate.
Here are the primary ways humanity is currently creating new food supplies:
1. Cellular Agriculture (Lab-Grown Food)
Instead of raising a whole animal, we grow just the parts we eat.
Cultivated Meat: Scientists take a small sample of animal cells and grow them in “bioreactors” (similar to beer vats). In 2025, several countries have approved “hybrid” products that mix these lab-grown cells with plant proteins to make burgers and nuggets more affordable.
Precision Fermentation: This uses microbes (yeast or fungi) as tiny “factories.” By giving them a genetic “instruction manual,” they can “brew” real milk proteins (casein/whey) or egg whites without needing a cow or a chicken.
2. Emerging Biological Sources
We are looking to the “neglected” parts of the biological world for high-density nutrition.
Microalgae and Seaweed: Algae like spirulina and chlorella are being turned into powders and oils. They grow incredibly fast, require no freshwater or fertilizer, and can be grown in tanks on non-arable land.
Entomophagy (Insect Protein): Crickets and mealworms are being processed into “invisible” ingredients like protein flours. They require a fraction of the water and land used by cattle and produce almost no greenhouse gases.
Mycoprotein: This involves fermenting the root-like structures of fungi (mycelium). It creates a high-fiber, high-protein “dough” that naturally mimics the fibrous texture of chicken or beef.
3. Decoupling from Geography
We are creating food supplies in places where farming was previously impossible.
Vertical and Indoor Farming: Using LED lights and “hydroponics” (water-based) or “aeroponics” (mist-based) systems to grow crops in city skyscrapers or underground bunkers. These systems use 95% less water and zero pesticides.
Desert Agriculture: New “liquid nanoclay” technology allows us to turn desert sand into fertile soil in hours rather than centuries, opening up vast new areas for supply.
4. The Circular Food Economy (Upcycling)
In 2025, we are increasingly creating food from “waste.”
Upcycled Ingredients: Transforming “side streams” from food processing—like the spent grain from beer brewing or the peels from fruit juice—into high-fiber snacks and flour.
Air-to-Protein: Some startups are now using “hydrogen-oxidizing bacteria” that eat $CO_2$ from the air and turn it into a protein powder. This is perhaps the ultimate new source: food made from thin air.
Source Type
Key 2025 Advantage
Scalability Limit
Cultivated Meat
Animal welfare & low land use
High energy cost for bioreactors.
Precision Fermentation
Identical to dairy/egg proteins
Public acceptance of “GE” microbes.
Insects
Extreme feed efficiency
Consumer “ick” factor in the West.
Vertical Farming
Urban proximity & zero pesticides
High electricity demand for LEDs.
What are nonrenewable mineral resources?
Non-renewable mineral resources are inorganic substances found in the Earth’s crust that exist in fixed, finite quantities.1 While they are technically created by nature, their formation through geological processes—such as heat, pressure, and volcanic activity—takes millions of years.2
Because we extract and use them far faster than the Earth can replenish them, they are considered exhaustible on a human timescale.3
1. Classification of Mineral Resources
Non-renewable minerals are generally divided into two main groups based on their properties and uses:
Category
Examples
Primary Uses
Metallic Minerals
Iron, Copper, Aluminum, Gold, Lithium, Rare Earth Elements
Construction, electronics, transportation, and green energy (batteries).
Construction (concrete/glass), agriculture (fertilizers), and chemicals.
2. How They Are Formed
The “mineral budget” of the planet was set by ancient geological events. Common formation processes include:
Magmatic Processes: High-value metals like platinum or chromium concentrate as molten rock (magma) cools deep underground.4
Hydrothermal Processes: Hot, mineral-rich fluids circulate through cracks in the crust, depositing metals like gold, silver, and copper.5
Sedimentary Processes: Minerals like iron or potash form over eons as water evaporates or organic materials settle and compress on ocean floors.
3. Key Differences: Minerals vs. Fossil Fuels
While both are non-renewable, they differ in a crucial way: Recyclability.
Fossil Fuels (Energy): When you burn coal or oil, the resource is chemically transformed into heat and gas ($CO_2$). It is “gone” once used.
Mineral Resources: A copper pipe or a gold ring is not “destroyed” when used. While the original deposit in the mine is non-renewable, the minerals themselves can often be recycled and reused indefinitely, which is a major focus of the “circular economy” in 2025.6
4. The “Critical Minerals” Problem
In 2025, a specific subset called Critical Minerals (like Lithium, Cobalt, and Graphite) has become vital for the global energy transition.
The Paradox: To move away from one non-renewable resource (fossil fuels), we must significantly increase the mining of other non-renewable resources (minerals) to build solar panels, wind turbines, and electric vehicles.
Environmental Impact: Mining these minerals is energy-intensive and can lead to habitat destruction, water contamination, and significant 7$CO_2$ emissions.8
5. Limits to Mineral Resources
We rarely “run out” of a mineral entirely. Instead, we reach an Economic Limit:
Ore Grade Decline: Over time, we use up the “easy,” high-quality deposits. We then have to mine much larger amounts of rock to get the same amount of metal, which requires more energy and money.
Environmental Limits: We may stop mining a resource not because it’s gone, but because the environmental cost (e.g., destroying a critical rainforest or using too much local water) becomes too high for society to accept.
What is the relationship between depletion curves and depletion rate estimates?
In the study of non-renewable resources, the relationship between depletion curves and depletion rate estimates is one of visualization versus quantification.
Think of a depletion curve as a “map” of a resource’s life, and the depletion rate estimate as the “speedometer” telling you how fast you are traveling along that map.
1. The Depletion Curve: The “Map”
A depletion curve is a graphical representation of the life cycle of a resource. It plots production or extraction over time.1
Hubbert’s Bell Curve: This is the most famous depletion curve. It suggests that production of a finite resource starts slowly, rises exponentially as infrastructure and demand grow, hits a peak, and then enters a permanent decline.2
The S-Curve (Logistic Curve): This plots cumulative production.3 It shows the total amount extracted over time, flattening out as the resource reaches total exhaustion.
Significance: The shape of the curve helps planners visualize whether a resource is in its “youth” (growth), “maturity” (peak), or “old age” (decline).
2. Depletion Rate Estimates: The “Speedometer”
A depletion rate is a numerical calculation of the speed at which a resource is being used up relative to its total size.4
Calculation Methods: * $\frac{R}{P}$ Ratio: The most common estimate. It divides current Reserves (5$R$) by annual Production (6$P$) to estimate the “years of supply” left.7
Depletion Level: A percentage showing how much of the Ultimately Recoverable Resource (URR) has already been taken.
Key Insight: If the depletion rate is 2%–3%, it usually correlates with a resource that has already reached or is very close to its production peak on the depletion curve.
3. How They Interact
The relationship is functional: Depletion rate estimates are used to draw and predict the shape of depletion curves.
When the Rate is…
The Curve is usually…
Meaning for the Resource
Increasing
Rising (Pre-Peak)
New technology and demand are driving rapid growth.
Stable at a High Level
Plateauing (Peak)
The environment/industry is at maximum capacity.
Declining
Falling (Post-Peak)
The “easy” resources are gone; extraction is becoming harder and more expensive.
4. The 2025 Reality Check
In 2025, the relationship is becoming more volatile due to Technology ($T$).
Shifting Curves: Advances like fracking or deep-sea mining can “bulge” a depletion curve, pushing the peak further out and temporarily lowering the depletion rate estimate.
Dynamic Reserves: As prices rise, “resources” (unprofitable stuff) are re-calculated as “reserves” (profitable stuff), which changes the math of the depletion rate and stretches the curve.
Key Takeaway: You cannot have an accurate depletion curve without reliable rate estimates. If your estimate of the total resource size is wrong, your curve will predict a “peak” that arrives too early or too late, leading to economic shocks.
What is the relationship between location and projected reserves of key minerals?
In 2025, the relationship between a mineral’s location and its projected reserves is no longer just about where a rock exists; it is about where it is economically and politically “accessible.”
While “resources” are scattered globally, “reserves” (the portion we can actually get to) are highly concentrated in a few specific geographic nodes.1
1. Geographic Concentration vs. Geologic Abundance
The primary characteristic of this relationship is extreme concentration. Even though minerals like lithium or rare earth elements (REEs) are found in many places, the projected economically extractable reserves are confined to a handful of countries.
Mineral
Primary Reserve Location (2025)
Share of Global Total
Cobalt
Democratic Republic of Congo (DRC)
~56%
Rare Earths
China
~48%
Nickel
Indonesia
~21%
Lithium
Chile / Australia / Argentina
~75% (The “Lithium Triangle”)
Graphite
China
~78% of production (largest reserves)
2. Location as a Barrier to “Reserves”
A mineral deposit only becomes a “reserve” if it can be mined profitably.2 Location dictates this through:
Infrastructure Accessibility: A massive copper deposit in the remote Arctic or the deep Amazon may stay a “resource” forever because the cost of building roads and power lines to reach it is higher than the value of the mineral.
Overburden and Depth: If a mineral is located deep beneath a stable city or a protected rainforest, it is effectively removed from “projected reserves” for social or legal reasons.
Processing Proximity: In 2025, location isn’t just about the mine. China currently controls over 60% of refining capacity for lithium and cobalt. If a country has the ore but no nearby way to refine it, its “reserves” are often seen as less secure or valuable by the global market.
3. The “Geopolitical Chessboard”
In late 2025, the “reserve” status of a mineral is increasingly defined by Resource Nationalism.3
Export Restrictions: Countries like Indonesia and Zimbabwe have restricted the export of raw ores (like nickel and lithium) to force companies to build refineries locally.4 This “relocates” the value of the reserve within the global supply chain.
Geopolitical Risk (GPR): Projections for reserves in volatile regions (like the DRC or Russia) are often “discounted” by investors. A deposit in a stable location like Australia or Canada is often faster to move from a “resource” to a “proven reserve” because of lower political risk.
4. New Frontiers and Discovery
While the “natural endowment” of a location cannot be changed, the projected reserves are shifting as exploration moves to new environments:
Deep-Sea Mining: Large reserves of manganese and cobalt are projected on the ocean floor (the Clarion-Clipperton Zone). However, international location-based regulations are still being debated in late 2025, keeping these from being classified as “proven reserves.”
Recycling as a “Virtual Mine”: Urban centers are becoming new “locations” for reserves. By 2030, analysts project that “urban mining” (recycling electronics) will provide a significant percentage of the world’s cobalt and lithium, bypassing traditional geographic limits.
Summary: Location vs. Reserve Projection
Factor
Impact on Reserve Projection
Geology
Sets the hard limit of “what is there.”
National Policy
Determines if the mineral is “allowed” to be a reserve (e.g., bans on mining).
Logistics
Determines the cost to move the mineral to market.
Stability
Determines the likelihood that the projected reserve will actually be mined.
What is importation of key minerals of a country?
The importation of key minerals is the process by which a country purchases and brings in essential mineral commodities from foreign sources to meet its domestic demand.1
Because no country is naturally endowed with every type of mineral, and because some minerals are too expensive or environmentally damaging to mine locally, importation becomes a vital pillar of a country’s economic stability and national security.
1. Why Countries Import Key Minerals
The decision to import rather than mine locally is driven by several factors:
Geological Scarcity: Some minerals, like Rare Earth Elements (REEs) or Cobalt, are only found in significant concentrations in a few specific locations (e.g., China or the DR Congo).2
Economic Viability: It is often cheaper to buy minerals from a country with established infrastructure and lower labor costs than to build a new mine from scratch.
Processing Gaps: A country might mine a raw ore (like lithium) but lack the specialized factories to refine it into a usable grade, forcing them to export the raw material and re-import the refined version.
Environmental Policy: Some nations choose to import minerals to avoid the heavy pollution, land disruption, and water usage associated with domestic mining.
2. Measuring Dependency: Net Import Reliance
Governments track their vulnerability using a metric called Net Import Reliance.3 This is the percentage of a mineral’s total consumption that comes from foreign sources.4
As of 2025, many major economies have high dependency on specific minerals:
Graphite & Manganese: Many industrialized nations are 100% dependent on imports for these, which are essential for steel and EV batteries.
Rare Earths: Used in everything from smartphones to fighter jets, these often have an import reliance of over 80% from a single source (usually China).
3. The Risks of Importation
While importation allows for global trade, it creates significant vulnerabilities:
Geopolitical Leverage: If a supplier country has a political dispute with a buyer, they may impose export restrictions or “weaponize” their minerals to put pressure on the importing nation.5
Supply Chain Disruptions: Natural disasters, wars, or pandemics can block shipping lanes or shut down foreign mines, causing immediate shortages in the importing country.6
Price Volatility: Since many key minerals are not traded on open exchanges like gold or oil, prices can spike suddenly due to small changes in foreign supply.
4. Strategic Responses (The 2025 Landscape)
In late 2025, countries are moving away from “simple importation” toward Supply Chain Resilience:
Friend-shoring: Moving import sources to “jurisdictionally friendly” allies (e.g., the U.S. importing more from Canada and Australia).
National Stockpiles: Maintaining “rainy day” reserves of critical minerals to survive a 6-month or 1-year supply cutoff.
Urban Mining: Increasing recycling efforts to recover minerals from old electronics, effectively creating a “domestic mine” out of waste.
Term
Meaning
Critical Mineral
A mineral essential to the economy whose supply is at high risk of disruption.
Strategic Mineral
A mineral specifically required for military and defense applications.
Conflict Mineral
Minerals (like tin, tantalum, tungsten, and gold) that may be mined in war zones to fund armed groups.
Are there any ocean mineral resources and recycling?
Ocean mineral resources and recycling are the two “frontier” solutions currently competing to secure the world’s supply of critical minerals for the green energy transition.
As of late 2025, the relationship between these two is a major global debate: should we extract “virgin” minerals from the deep sea or focus entirely on a “circular economy” through recycling?
1. Ocean Mineral Resources: The Three “Treasure Chests”
The ocean floor contains vast mineral deposits that often have much higher concentrations of metals than those remaining on land.1 These are categorized into three main types:
Resource Type
Primary Minerals
Location/Depth
Polymetallic Nodules
Manganese, Nickel, Cobalt, Copper
Abyssal plains (4,000–6,000m depth). Potato-sized lumps sitting on the sand.
Cobalt-Rich Crusts
Cobalt, Platinum, Nickel
Flanks of undersea mountains (seamounts). Hard metallic “skins” on rock.
Seafloor Massive Sulfides
Gold, Silver, Copper, Zinc
Hydrothermal vents (“black smokers”). Deep chimneys formed by volcanic heat.
The 2025 Reality: The Clarion-Clipperton Zone (CCZ) in the Pacific is the primary focus.2 It is estimated to contain more cobalt and nickel than all known land reserves combined. In early 2025, the U.S. fast-tracked domestic exploration of these resources to reduce reliance on foreign imports.3
2. The Recycling Alternative (The Circular Economy)
Many scientists and environmental groups argue that we do not need to mine the ocean if we improve recycling.4
Urban Mining: This involves recovering minerals from end-of-life products like smartphone batteries, electric vehicle (EV) motors, and laptop circuit boards.5
Potential for Reduction: A 2022-2025 study by the WWF and SINTEF found that by 2050, nearly 100% of the demand for critical minerals could be met through recycling and “circular” design, potentially making deep-sea mining unnecessary.6
Technological Shifts: New battery chemistries (like LFP – Lithium Iron Phosphate) are already reducing the global demand for cobalt and nickel—the two main “prizes” of ocean mining.7
3. The 2025 Conflict: Deep-Sea Mining vs. Conservation
The relationship between ocean resources and recycling is currently a “tug-of-war” between two schools of thought:
A. The Pro-Mining Argument (Economic Security):
Terrestrial mines are becoming lower in quality and more dangerous to operate.
Ocean mining doesn’t require “displacing human communities” or cutting down rainforests.8
It provides a massive, secure supply of the minerals needed to build wind turbines and EVs to fight climate change right now.
B. The Pro-Recycling/Moratorium Argument (Environmental Risk):
Sediment Plumes: Mining machines stir up “dust clouds” of silt that can travel hundreds of kilometers, smothering coral and plankton.9
Food Web Disruption: A 2025 study found that mining sediment caused plankton to eat less nutritious particles, potentially collapsing the ocean food chain.10
The “Sink” Limit: The deep sea is a massive carbon sink. Disturbing it could release stored carbon back into the atmosphere, worsening the very climate crisis we are trying to solve.11
4. Current Legal Status (Late 2025)
International Waters: The International Seabed Authority (ISA) is still finalizing the “Mining Code.”12 As of December 2025, over 40 countries have called for a moratorium (a temporary ban) until the ecological impacts are fully understood.
National Waters: Some countries are moving faster. Norway and Japan have already approved or begun deep-sea exploration within their own national borders to secure their resource futures.
Summary Comparison
Feature
Deep-Sea Mining
Advanced Recycling
Supply Potential
Massive and immediate.
Grows as more EVs reach end-of-life.
Cost
High initial investment in robotics.
High cost of collection and separation.
Ecological Impact
Habitat destruction; sediment plumes.
Very low (pollution from chemical baths).
2025 Status
Exploration stage; highly controversial.
Rapidly expanding in EU and China.
What is the environmental impact of mineral extraction?
As of late 2025, the environmental impact of mineral extraction is a subject of intense global scrutiny.1 While minerals are essential for the “Green Energy Transition” (powering EVs and solar panels), the process of getting them out of the ground—or the ocean—carries a heavy ecological price.2
The impact is generally categorized into five “red zones” of environmental damage.
1. The “Water Crisis” of Extraction3
Mining is incredibly water-intensive, and as of 2025, approximately 16%–20% of the world’s land-based mines are located in areas of high or extreme water stress.
Depletion: In the “Lithium Triangle” (Chile, Argentina, and Bolivia), lithium extraction consumes roughly 500,000 gallons of water per ton of lithium carbonate produced.4 In Chile’s Salar de Atacama, mining has consumed over 65% of the local water supply.5
Acid Mine Drainage (AMD): This is one of mining’s most persistent legacies.6 When sulfide minerals are exposed to air and water, they create sulfuric acid, which leaches heavy metals into the water table.7 This toxic runoff can persist for hundreds of years.
2. Land Degradation and “Tailings”
Surface Displacement: Open-pit and strip mining remove entire mountaintops and massive tracts of vegetation.8 This leads to severe soil erosion; in some regions, mining-related erosion has increased by 70% in 2025.9
Toxic Waste (Tailings): The “leftovers” of mining—crushed rock and chemicals—are stored in massive dams.10 By 2025, roughly 9% of the world’s disclosed tailings dams are located within protected natural areas, posing a constant risk of catastrophic failure and habitat poisoning.11
3. The Carbon Paradox
There is a stark irony in 2025: the minerals needed to reduce carbon emissions (like nickel and cobalt) often generate massive emissions during their own production.12
Energy Intensity: Processing facilities, particularly for nickel in Indonesia, are often powered by coal-fired plants.13
Deforestation: In mineral-rich regions like the Amazon Basin and Southeast Asia, mining is forecasted to be linked to up to 85% of new regional forest loss by late 2025, removing vital carbon sinks.14
4. Biodiversity and Habitat Loss
Fragmentation: Mining breaks continuous forests into isolated patches, creating “islands” that cannot support large wildlife populations.15
Extinction Risks: In 2025 hotspots like the Clarion-Clipperton Zone (for deep-sea mining), over 5,000 new species have been discovered that are now at risk before we even fully understand their role in the ecosystem.16
5. Deep-Sea Mining: The New Frontier
With land-based reserves declining, 2025 has seen a push toward the ocean floor. However, this introduces new risks:
Sediment Plumes: Mining machines stir up “dust clouds” of silt that can travel hundreds of kilometers, potentially smothering coral and disrupting the base of the ocean food web.17
Light and Noise Pollution: Deep-sea organisms adapted to total darkness and silence are severely stressed by the industrial activity of mining vessels.
Summary of 2025 Environmental Impacts
Impact Type
Estimated Scale / Stat
Primary Resource Affected
Water Pollution
~30% rise in local cases
Groundwater and local watersheds.
Deforestation
Up to 85% in key regions
Tropical and temperate forests.
Soil Erosion
70% increase in local rates
Topsoil (A-horizon) and fertility.
Waste (Tailings)
>100,000 tons released/year
Aquatic ecosystems and soil.
What is energy in the economy?
In economics, energy is not just another commodity; it is the fundamental driver of work and the “metabolism” of the modern world.1 Without energy, every other factor of production—labor, land, and capital—would be static.
As of late 2025, the definition of energy in the economy has shifted from being a simple “input” to being a central pillar of national security and environmental sustainability.2
1. Energy as a Factor of Production3
Traditional economics lists Land, Labor, and Capital as the primary inputs for production.4 However, modern “Energy Economics” argues that energy is a fourth, indispensable factor.5
The “Work” of Energy: Energy is the capacity to do physical work.6 In a factory, electricity “does the work” that thousands of humans would otherwise have to do by hand.
Productivity Link: Historically, every major jump in global GDP has been preceded by a jump in energy use (e.g., the Steam Engine/Coal, the Internal Combustion Engine/Oil, and now the Digital Revolution/Electricity).
2. The Economic Functions of Energy
Energy moves through the economy in three distinct roles:
Role
Description
Example in 2025
Intermediate Input
Used to create other goods.
Natural gas used to create nitrogen fertilizers for food.
Energy Service
Provides a direct utility or state.
Electricity providing “light” for a warehouse or “cooling” for a data center.
Final Product
Purchased directly by consumers.
Gasoline bought at a pump or a home heating bill.
3. Energy Intensity: The Efficiency Metric
One of the most important concepts in 2025 is Energy Intensity—the amount of energy needed to produce one unit of GDP.
Decoupling: Wealthy nations are currently “decoupling” their economies, meaning their GDP is growing while their energy use stays flat or even falls. This is achieved through high-efficiency tech (like LEDs and heat pumps).
AI Demand: In contrast, the rise of AI and data centers in 2025 has created a new surge in energy intensity, as a single AI data center can consume as much power as 100,000 homes.7
4. The “Energy Trio” of 2025
Economists and policymakers now evaluate energy based on three competing priorities, often called the Energy Trilemma:
Affordability: Can businesses and households afford the power they need to survive?
Security (Reliability): Is the supply protected from geopolitical shocks (like wars or trade bans)?8
Sustainability: Does the energy use push the planet past its Planetary Boundaries?
Key takeaway: In 2025, money is essentially a proxy for energy. As scientist Vaclav Smil famously put it, every economic activity is fundamentally just the conversion of one kind of energy into another.9
What is energy production and energy consumption?
Energy production and energy consumption represent the two ends of the global energy system.1 In 2025, the relationship between them is becoming more complex as the world “electrifies”—meaning more of our production is being turned into electricity, and more of our consumption is coming from a plug rather than a fuel tank.
1. Energy Production (The Source)
Energy production refers to the process of capturing or extracting energy from nature. This is usually categorized as Primary Energy.2
Fossil Fuel Production: Extracting coal, oil, and natural gas.3 In 2024–2025, these still account for the majority of global supply, though their growth is slowing.
Renewable Energy Production: Capturing energy from infinite flows like sunlight, wind, and falling water.4 In 2025, a historic milestone was reached as solar and wind power generation grew fast enough to meet nearly all new global electricity demand.5
Nuclear Production: Using the heat from splitting uranium atoms to create steam for electricity.6
2. Energy Consumption (The Use)
Energy consumption is divided into two stages to account for the energy lost during delivery:
Primary Energy Consumption: The total energy a country “needs” at the start.7 It includes the energy used by power plants themselves and the energy lost as heat during transport through wires or pipes.
Final Energy Consumption: The energy that actually reaches the end-user.8 As of 2025, the global average is that only about 67% to 70% of primary energy actually makes it to final consumption; the rest is lost in transition.
Major Consumption Sectors in 2025:
Industrial: Manufacturing, mining, and construction (the largest user globally).
Transport: Moving people and goods.9 Notably, in 2025, transport is shifting from oil consumption (gasoline) to electricity consumption (EVs).10
Residential/Commercial: Heating, cooling, and powering our homes and offices.11
Data Centers/AI: A rapidly growing “new” consumer.12 In 2025, data centers are consuming an increasingly significant share of the global power grid.13
3. The “Transformation” Link
Production and consumption are connected by Energy Transformation. For example, we produce “Chemical Energy” (coal), transform it into “Thermal Energy” (steam), then into “Mechanical Energy” (spinning turbine), and finally into “Electrical Energy” (power lines).
Concept
Definition
2025 Trend
Energy Mix
The specific blend of sources used (Coal, Solar, etc.).
Shifting rapidly toward renewables; solar is now the fastest-growing source.
Electrification
The shift of end-uses (like cars or heaters) to electricity.
Accelerating; electricity demand is growing twice as fast as total energy demand.
Energy Intensity
The energy used per dollar of GDP produced.
Improving (getting more wealth from less energy), but slowed by AI and heavy industry.
4. The 2025 Reality: Production vs. Consumption
A key challenge in 2025 is that Production is often far from Consumption.
Geographic Gap: Huge amounts of energy are produced in places like the Middle East or the Australian outback but consumed in megacities like Tokyo or London.
The “Net-Zero” Gap: To meet climate goals, we must produce more energy from clean sources than we consume from fossil sources. In the first half of 2025, for the first time on record, global renewable electricity generation overtook coal.14
What is the U.N. energy policy?
The United Nations energy policy is not a single law, but a global framework of goals and “roadmaps” designed to balance economic development with environmental survival.
As of late 2025, the policy is centered on the UN-Energy Plan of Action Towards 2025, which serves as the final sprint toward the 2030 Sustainable Development Goals (SDGs).
1. The Core Pillar: SDG 7
The foundation of all UN energy policy is Sustainable Development Goal 7, which mandates “Affordable, Reliable, Sustainable and Modern Energy for All.”1 It has three specific targets for 2030:2
Universal Access: Ensuring every person on Earth has electricity and clean cooking solutions.3
Renewables: Substantially increasing the share of solar, wind, and other renewables in the global energy mix.4
Efficiency: Doubling the global rate of improvement in energy efficiency (doing more work with less power).5
2. The 2025 “Acceleration Agenda”
In response to stalling progress, the UN Secretary-General launched an Acceleration Agenda to push for faster transitions. Key 2025 milestones include:
The “No New Coal” Pledge: A policy push to ensure no new coal power plants are entered into the global pipeline after 2021/2022.6
Subsidies Shift: A call for all nations to re-direct fossil fuel subsidies (currently trillions of dollars) toward renewable energy and efficiency by the end of 2025.7
Doubling Investment: A target to double annual global investment in renewables and energy efficiency by the end of this year.8
3. Key Global Initiatives in 2025
The UN coordinates its policy through several high-level groups and partnerships:
Initiative
2025 Focus Area
UN-Energy
Coordinating the 30+ UN agencies (like UNDP, UNEP, and WHO) to act as one on energy projects.
Mission 300
A 2025 summit-led partnership to bring electricity to 300 million people in Africa by 2030.
Energy Compacts
Voluntary commitments from over 200 governments and companies, totaling over $600 billion in clean energy finance.
SEforALL
(Sustainable Energy for All) The primary “implementation arm” that helps countries design national energy transition plans.
4. The Policy Strategy: A “Just Transition”
A major theme in 2025 is the Just Energy Transition.9 The UN policy insists that moving away from fossil fuels must not leave people behind.
Decentralized Solutions: For the 660 million people still without power in 2025, the policy favors “mini-grids” and off-grid solar rather than waiting decades for traditional power lines to reach remote areas.10
Clean Cooking: This is a 2025 policy priority.11 Over 2 billion people still cook with wood or dung, leading to millions of deaths from indoor air pollution.12 The UN is pushing for a shift to electric or gas cooking as a matter of global health.13
Job Creation: The roadmap projects that the energy transition could create 60 million new jobs in renewables by 2030, provided countries invest in “re-skilling” current fossil fuel workers.14
The 2025 Reality: According to the Tracking SDG7: The Energy Progress Report 2025, the world is currently “off-track” for 2030.15 While 92% of the world has electricity, the pace of clean cooking and renewable heating is moving too slowly to meet the 1.5°C climate target.
What is the adequacy of fossil fuels?
The adequacy of fossil fuels refers to the availability of coal, oil, and natural gas to meet the world’s energy demands. In late 2025, the conversation around adequacy has shifted: it is no longer a question of whether the Earth will “run out” of these resources, but whether we can extract them fast enough and at a cost the planet can afford.
The adequacy of fossil fuels today is defined by three factors: Geologic Availability, Investment Gaps, and the Carbon Budget.
1. Geologic Adequacy: The “Full Tank”
From a purely physical standpoint, the Earth still contains vast amounts of fossil fuels.
Reserves-to-Production (R/P) Ratio: This traditional metric estimates how many years of a resource remain at current consumption rates. As of 2025, the world generally has:
Oil: ~50 years
Natural Gas: ~50 years
Coal: ~130+ years1
The “Dynamic” Reserve: Geologic adequacy is not fixed. As technology improves (e.g., better fracking or deep-sea drilling) and prices rise, “resources” that were once too difficult to reach are reclassified as “proven reserves,” effectively lengthening the timeline.
2. The “Investment Gap” Risk
Even if the fuel exists in the ground, it is only “adequate” if it can be brought to market. In 2025, a major threat to adequacy is the decline in new investment.2
Natural Decline: Existing oil and gas wells naturally lose productivity over time (oil wells can decline by ~15% per year).3
The Shortfall Warning: According to 2025 energy reports, if investment in new fossil fuel supply stops entirely, the world could face a shortfall of 70 million barrels of oil per day by 2030.4
The Paradox: Financial institutions are increasingly pulling away from fossil fuels to meet climate goals, creating a “tug-of-war” between the need for short-term energy security and long-term decarbonization.
3. Economic vs. Environmental Adequacy
In the modern economy, “adequate” doesn’t just mean “available”—it means affordable and sustainable.
The Price of Scarcity: As “easy” oil is depleted, we must move to “frontier” projects (Arctic drilling, ultra-deepwater).5 These are much more expensive, meaning fossil fuels may become economically inadequate for many developing nations.
The Carbon Budget Limit: This is the most critical constraint in 2025. The “atmospheric adequacy” for carbon is exhausted.6
The 2025 Global Carbon Budget report states that if we burn even a fraction of current proven reserves, we will exceed the $1.5^\circ\text{C}$ warming limit.
In this sense, fossil fuels are “over-abundant” for the climate but “precariously balanced” for the economy.
Fuel Type
2025 Status
Adequacy Challenge
Coal
Most Abundant
High carbon intensity; rapid phase-out in the West, but still growing in Asia.
Oil
Tightest Supply
High reliance on a few geographic nodes (OPEC+); transport electrification is slowing demand growth.
Natural Gas
Transition Fuel
Seen as “adequate” for the mid-term, but infrastructure (LNG terminals) is expensive and slow to build.
4. Summary: The 2025 Outlook
While there is enough fossil fuel in the ground to power the world for decades, their functional adequacy is failing. The world is currently in a “surplus” of supply (inventories are high in late 2025), yet we are facing record-high emissions and a “production gap” where planned extraction far exceeds what is safe for the climate.
What are the energy options?
In 2025, the global energy landscape has reached a historic turning point. For the first time, renewable energy generation (specifically solar and wind) has overtaken coal as the world’s leading source of electricity.1
When we talk about “energy options,” we are looking at a diverse mix of technologies that are currently competing to power our cities, transport, and industries.
1. The “Clean” Leaders (Renewables)
Renewables are the fastest-growing energy option because they are now the cheapest source of new power in 91% of the world.
Solar Power: The “king” of 2025. Solar generation grew by a record 31% in the first half of this year.2 High-efficiency Perovskite cells and Bifacial panels (which catch light on both sides) are now pushing utility-scale costs as low as $0.02 per kWh.
Wind Power: Onshore wind is a mature staple, while Floating Offshore Wind is the new frontier, allowing turbines to be placed in deeper waters with stronger, more consistent winds.3
Hydropower: The world’s largest source of renewable baseload power. In 2025, the focus has shifted from massive new dams to “Pumped Hydro Storage,” which acts like a giant water battery for the grid.
Geothermal: Tapping into the Earth’s internal heat.4 New “Enhanced Geothermal Systems” (EGS) are being piloted in 2025 to allow geothermal energy to be harvested almost anywhere, not just near volcanoes.5
2. The Baseload Pillar (Nuclear)6
Nuclear energy is seeing a massive “renaissance” in 2025, driven largely by the massive power needs of AI and Data Centers.7
Large-Scale Fission: Traditional plants are being refurbished or restarted (like the Three Mile Island site) to provide 24/7 carbon-free power.
Small Modular Reactors (SMRs): These are smaller, factory-built reactors that are easier to fund and safer to operate.8 Tech giants like Google and Amazon signed major agreements in 2025 to use SMRs to power their AI operations.
Nuclear Fusion: Often called the “Holy Grail,” fusion has moved from pure science to a strategic national priority.9 In late 2025, private investment in fusion has surpassed $10 billion, with roadmaps now targeting the first commercial power to the grid by the mid-2030s.10
3. The “Transition” and Fossil Options
While fossil fuels are in structural decline, they still provide a significant portion of the global “energy metabolism.”
Natural Gas: Often labeled a “bridge fuel,” natural gas is increasingly paired with Carbon Capture and Storage (CCS) to reduce its footprint.
Green Hydrogen: In 2025, hydrogen produced using renewable electricity is emerging as the primary option for “hard-to-abate” sectors like steel manufacturing and heavy shipping.11
Coal and Oil: These remain the “energy of last resort” or the legacy baseline in many regions, though coal generation fell globally in 2025 as renewables filled almost all new demand growth.12
4. Energy Storage (The Enabling Option)
Because solar and wind are intermittent, the most important “energy option” in 2025 isn’t just how we make power, but how we save it.
Technology
Best Use Case
2025 Status
Lithium-Ion (LFP)
EVs and short-term grid backup.
Costs have fallen 93% since 2010.
Solid-State Batteries
Next-gen EVs with longer range.
First commercial pilot lines launched this year.
Flow Batteries
Long-duration (10+ hours) grid storage.
Preferred for large-scale renewable farms.
Thermal Storage
Industrial heat and concentrated solar.
Uses molten salts or sand to hold heat for days.
Summary: Which option is winning?
As of late 2025, the “winning” strategy for most countries is Electrification. By shifting cars, heating (via heat pumps), and industry to the electric grid, and then powering that grid with a mix of Solar + Wind + Storage + Nuclear, nations are achieving the “Energy Trilemma”: security, affordability, and sustainability.
Are there alternative energy options?
In 2025, the term “alternative energy” has evolved. It no longer just refers to “anything that isn’t oil.” Instead, it is a broad category that includes renewable energy (like solar and wind) and non-renewable clean energy (like nuclear).1
As of late 2025, the most significant trend is Electrotech—the suite of technologies that allows us to switch our most energy-hungry activities (like driving and heating) from fuels to a clean electric grid.
1. The “Big Three” Alternatives
These are currently the most scalable and cost-effective alternatives to fossil fuels.
Solar Photovoltaics (PV): By late 2025, solar has officially become the world’s leading source of electricity. New Perovskite solar cells are entering the market, offering higher efficiency and the ability to be printed onto flexible surfaces like windows or backpacks.
Wind (Onshore & Offshore): While onshore wind is common, 2025 has seen a massive push into Floating Offshore Wind.2 These turbines can be placed further out at sea where winds are stronger and more consistent, avoiding “not in my backyard” (NIMBY) issues on land.
Nuclear (Large and Small): Nuclear is an “alternative” but not “renewable” (it uses finite uranium).3 2025 is the year of the Small Modular Reactor (SMR); tech giants like Google and Amazon are now using these “mini-plants” to provide the 24/7 power required for AI and data centers.4
2. Emerging Chemical & Biological Alternatives
For sectors that cannot easily run on batteries (like heavy shipping or steel manufacturing), we use chemical alternatives.
Option
2025 Role
Key Advantage
Green Hydrogen
Heavy Industry
Created by splitting water with solar/wind. It releases only water vapor when burned.
Advanced Biofuels
Aviation & Shipping
Made from non-food waste (like cooking oil or agricultural scraps) to avoid competing with food supplies.
Biogas/Biomethane
Heating
Produced from organic waste in cities and farms. It can be injected directly into existing gas pipes.
3. The “New” Geologic Alternatives
We are moving beyond simple dams to more sophisticated ways of using the Earth’s natural energy.
Enhanced Geothermal Systems (EGS): Historically, you needed a volcano nearby to get geothermal energy. In 2025, new drilling tech (similar to fracking but for heat) allows us to tap into the Earth’s hot basement rock almost anywhere.
Tidal and Wave Energy: While still smaller in scale, 2025 has seen several “kite-like” underwater turbines deployed in the UK and Japan, capturing the predictable energy of the tides.
4. “Virtual” Energy Options
One of the biggest “sources” of energy in 2025 is actually Efficiency. If we don’t use the energy, we don’t have to produce it.
Heat Pumps: These “alternative” heaters are replacing gas boilers worldwide.5 They don’t create heat; they move it from the outside air into your home, using 3 to 4 times less energy than traditional heaters.
Vehicle-to-Grid (V2G): In 2025, your parked electric car is an “alternative energy source.” During peak hours, your car can sell electricity back to the grid, helping to balance supply.
Summary: Renewable vs. Alternative
Is it…
Renewable?
Alternative?
Examples
Solar/Wind
Yes
Yes
Sunlight, Wind, Tides
Nuclear
No
Yes
Uranium fission, SMRs
Natural Gas
No
No*
(Sometimes called “alternative” to coal, but generally excluded now).
What is environmental degradation?
Environmental degradation is the process where the natural environment—including air, water, and soil—is compromised, leading to a decline in its quality and health.1 It essentially means the Earth’s systems are being damaged faster than they can recover, reducing their ability to support life, maintain biodiversity, and provide essential resources.
In late 2025, environmental degradation is no longer viewed as a distant threat but as an immediate crisis. This year, scientists confirmed that 2025 was one of the three hottest years on record, and the three-year global average temperature has, for the first time, consistently breached the 1.5°C threshold set in the Paris Agreement.2
1. The Major Types of Degradation
Degradation occurs across all parts of the Earth’s “life support system”:
Atmospheric Degradation: The buildup of greenhouse gases (CO₂, methane) and air pollutants.3 In 2025, this has led to “Global Weirding”—extreme and unpredictable weather patterns like the record-shattering wildfires in Canada and devastating floods in Europe and Brazil.
Water Degradation: Includes both the scarcity of freshwater and the pollution of oceans and rivers. Microplastics have now been found in every level of the food chain, from deep-sea trenches to human blood.
Soil and Land Degradation: Caused by intensive agriculture, deforestation, and urban sprawl.4 Currently, more than 68 billion tons of topsoil are lost every year—a rate 100 times faster than it can naturally be replaced.5
Biodiversity Loss: Often called the “Sixth Mass Extinction.”6 This involves the rapid disappearance of plant and animal species due to habitat destruction and climate change.7
2. Key Drivers in 2025
While natural disasters (like volcanoes or earthquakes) can degrade the environment, the modern crisis is almost entirely human-induced:
Overpopulation & Consumption: As the population continues to grow, so does the demand for food, energy, and land.8 Industrialized nations have a disproportionately large “footprint” compared to developing ones.
Fossil Fuel Dependence: The burning of oil, coal, and gas remains the primary driver of climate-related degradation.9
Unsustainable Agriculture: Intensive farming uses vast amounts of water and chemicals that strip the soil of nutrients and poison local waterways through runoff.10
The “Mineral Conundrum”: In 2025, even the transition to green energy is causing degradation; the mining of “critical minerals” like cobalt and lithium for EV batteries is leading to habitat destruction in places like the DR Congo and the deep sea.11
3. The Consequences: Why It Matters
Environmental degradation isn’t just about “nature”; it directly impacts human survival:
Impact Category
Real-World Effect (2025)
Human Health
Increased respiratory diseases (asthma/pneumonia) from air pollution and new pathogens emerging from melting permafrost.
Food Insecurity
Degraded soil and extreme droughts are causing “harvest failures” in global breadbaskets, driving up food prices.
Economic Loss
Extreme weather in 2025 has already caused hundreds of billions of dollars in infrastructure damage and lost productivity.
Climate Migration
“Environmental refugees” are increasingly common as coastal erosion and desertification make traditional homelands uninhabitable.
4. Is It Reversible?
In 2025, the focus has shifted from “prevention” to “restoration and adaptation.” * Rewilding: Reintroducing native species to restore ecosystem balance.
Circular Economy: Moving away from a “take-make-waste” model to one where materials are recycled indefinitely.
Nature-Based Solutions: Using wetlands and forests as natural “carbon sinks” and flood barriers.
What is pollution?
Pollution is the introduction of harmful materials (pollutants) or energy (heat, light, noise) into the environment that cause adverse changes to the air, water, or land.1
In late 2025, pollution is defined not just as “trash” or “smoke,” but as a global health crisis.2 According to the State of Global Air 2025 report, pollution remains the leading environmental risk factor for death, contributing to over 8 million deaths annually—more than tobacco or poor diet.
1. The Major Forms of Pollution
Pollution is typically classified by the part of the environment it affects:3
Air Pollution: The release of chemicals and particulates into the atmosphere.4
Key 2025 Fact: Over 99% of people on Earth now breathe air that exceeds WHO safety limits.5 The primary culprits are fine particulate matter ($PM_{2.5}$) and ground-level ozone, which cause heart disease, strokes, and—for the first time confirmed in 2025—increased rates of dementia.
Water Pollution: The contamination of water bodies (oceans, rivers, groundwater).6
The “Forever Chemical” Crisis: 2025 has seen a massive policy shift toward regulating PFAS, toxic “forever chemicals” that have now been detected in nearly all freshwater sources globally.
Soil Pollution: The presence of toxic chemicals in the earth, often from industrial waste or pesticides.7
Legacy Pollutants: Severe floods in 2025 have “remobilized” old industrial toxins buried in river sediments, spreading them across fertile farmland.8
Light and Noise Pollution: These “intangible” pollutants disrupt the biological clocks (circadian rhythms) of both humans and wildlife, leading to sleep disorders and ecosystem collapse.9
2. Sources: Where does it come from?
Pollution in 2025 is primarily driven by three sectors:
Energy (The #1 Polluter): Burning coal, oil, and gas for electricity and heat accounts for nearly 38 billion tonnes of 10$CO_2$ emissions this year.11
Transport: While EVs are rising, internal combustion engines still contribute the majority of urban nitrogen oxides ($NO_x$), creating the “smog” seen in megacities.
Agriculture: The use of synthetic fertilizers releases ammonia and nitrous oxide, while “mismanaged” manure pollutes local water tables.12
3. The 2025 “Frontiers” of Pollution
In late 2025, several emerging types of pollution have taken center stage:
Microplastics: They are no longer just in the ocean; they are “airborne.” 2025 studies show we inhale thousands of microplastic fibers every week.
Space Debris: With the explosion of private satellite launches, “orbital pollution” is now a threat to global communication systems.
Cryptocurrency & AI Pollution: The massive energy demand for AI data centers and crypto mining has led to a spike in local “thermal pollution” (heat released into rivers) and electronic waste (e-waste).
4. Impact: The Human and Economic Cost
Pollution is a “poverty multiplier.”13 While it affects everyone, it disproportionately hits low-income communities who cannot afford air filtration or clean water.
Impact Category
2025 Statistics / Findings
Health
86% of pollution-related deaths are from non-communicable diseases (strokes, COPD).
Children
1 in 8 deaths in children under five is linked to air pollution.
Economy
Global healthcare costs and lost productivity from pollution are estimated to exceed $8 trillion annually.
Climate
Short-lived pollutants like “black carbon” are accelerating the melting of glaciers in 2025.
What wildlife and habitat preservation?
In late 2025, wildlife and habitat preservation have moved from being “extra” environmental concerns to being viewed as essential for planetary stability.1 While “preservation” focuses on keeping intact ecosystems safe, “restoration” (fixing what is broken) has become a multi-billion dollar global industry this year.
The current state of preservation is defined by the “30 by 30” goal—a global commitment to protect 30% of the world’s land and oceans by 2030.2
1. The Core Strategy: Preservation vs. Restoration
In 2025, conservationists distinguish between these two vital actions:
Preservation (The Shield): Protecting existing, “untouched” wilderness. This is the most effective and cost-efficient way to save species.
2025 Milestone: Colombia banned all new oil and mining projects in the Amazon this year, protecting 48 million hectares of primary forest.3
Restoration (The Hospital): Actively rebuilding ecosystems that have been degraded.4
Market Trend: The global habitat restoration market has surged to nearly $4.8 billion in 2025 as companies buy “biodiversity credits” to offset their environmental impact.
2. The 2025 Status Report: “A Warning Light”
The latest Living Planet Report 2025 reveals a “stark picture” of wildlife health. While some populations are recovering, the overall trend is down.
Habitat Type
Average Population Decline (since 1970)
Key 2025 Threat
Grasslands
62% Decline
Conversion to agriculture and severe droughts.
Forest Mammals
42% Decline
Habitat fragmentation (building roads through forests).
Marine/Coastal
36% Decline
Overfishing and “marine heatwaves.”
Freshwater
Stable/Slight Increase
Positive result of dam removals and wetland protection.
3. “30 by 30” Progress at the Halfway Point
2025 marks the midpoint for the 30 by 30 initiative.5 Progress is mixed:
Land: Roughly 17.6% of terrestrial land is currently protected.6 Many regions (like Maryland, USA) hit the 30% mark early this year.7
Ocean: Only about 8-10% of oceans are protected.8 In 2025, the focus has shifted to “Marine Refugia”—specific parts of the ocean that stay cooler during heatwaves, acting as a sanctuary for coral.
4. Innovation: Community-Led Conservation
A major shift in late 2025 is the recognition that Indigenous Peoples and local communities are the most effective stewards of nature.9
Indigenous Recognition: At the UN climate summit (COP30) in Brazil last month, nine countries pledged to formally recognize 160 million hectares of Indigenous lands by 2030.10
Wildlife Crossings: In 2025, several nations passed laws requiring “wildlife bridges” over highways. These prevent “habitat fragmentation,” allowing animals like grizzly bears and koalas to find mates and food without being hit by cars.
5. Why It Matters: The “Spillover” Link
UN policy in 2025 now links habitat preservation directly to human health. The WHO Pandemic Agreement, adopted in May 2025, specifically identifies deforestation and wildlife trade as the primary drivers of “disease spillover” (where viruses jump from animals to humans).11 Preserving habitats is now officially a strategy for preventing the next pandemic.
What is nonrenewable natural resource management?
Non-renewable natural resource management is the strategic planning, extraction, and use of finite Earth materials (like fossil fuels and minerals) to maximize their economic value while minimizing environmental damage.1
Since these resources cannot be replaced once used, the core philosophy in 2025 is “managed depletion.” This involves balancing the world’s current industrial needs with the urgent requirement to transition to renewable alternatives before these finite stocks run out or cause irreversible climate damage.
1. The Core Objectives in 2025
Modern management of these resources follows three main pillars:
Intergenerational Equity: Ensuring that today’s extraction of oil or copper doesn’t leave future generations with a bankrupt environment or a total lack of essential materials.
Substitution (The Hotelling Rule):2 A key economic principle that dictates that as a non-renewable resource is depleted, the profits from its sale should be invested in renewable substitutes (like solar infrastructure or battery tech) so the total “wealth” of the planet stays constant.3
Internalizing Costs: Historically, the “price” of coal didn’t include the cost of the lung disease or climate change it caused. In 2025, management policies use Carbon Taxes and Extraction Quotas to make the market reflect these “hidden” environmental costs.4
2. Management Strategies
Governments and corporations use several specific “tools” to manage these finite assets:
Strategy
Description
2025 Application
Reserve Tracking
Using AI and satellite mapping to constantly update “Proven Reserves” vs. “Undiscovered Resources.”
Helping countries like Chile manage lithium “budgets” for the next 30 years.
Circular Mining
Moving from a “dig and discard” model to “Urban Mining.”
Recovering cobalt and gold from old smartphones to reduce the need for new mines.
Tailings Management
Regulating the disposal of toxic mining waste to prevent catastrophic dam failures.
New 2025 global standards require 24/7 digital monitoring of all waste sites.
Sovereign Wealth Funds
Investing resource profits into a national fund for the future.
Norway’s Oil Fund is the classic example; Saudi Arabia is now doing the same with its “Vision 2030” pivot.
3. The 2025 “Transition” Reality
In late 2025, management is increasingly about “Stranded Assets.” As the world moves toward the UN’s SDG 7 (Clean Energy), many oil and coal reserves are becoming “economically adequate” but “environmentally unusable.”
The Production Gap: Management now involves deciding which mines and wells to shut down early to meet climate targets without crashing the global economy.
Methane Abatement: A major 2025 focus is managing the “leaks” from natural gas infrastructure. AI is now used to detect and seal these leaks, which are responsible for a significant portion of short-term global warming.
4. International Frameworks
Because resources don’t follow borders, management is coordinated through global systems:5
UN Resource Management System (UNRMS): A 2025 framework that helps countries classify their minerals and fuels in a way that aligns with the Sustainable Development Goals.
Critical Raw Materials Acts: Specific laws (like those passed in the EU and USA in 2024–2025) that manage the “secure supply” of minerals like Lithium and Graphite, ensuring they aren’t controlled by a single geopolitical rival.
Key Takeaway: In 2025, “good management” of a non-renewable resource is defined by how quickly you can make that resource unnecessary through innovation and recycling.
What is environmental equity?
Environmental equity is the principle that no single group or community should bear a disproportionate share of environmental burdens or be denied the benefits of environmental resources.1 It is the core objective of the Environmental Justice movement.2
In late 2025, the concept has evolved from a simple “anti-pollution” stance into a proactive framework for how the world manages the transition to green energy and copes with accelerating climate change.
1. The Three Pillars of Equity
To achieve environmental equity, three specific types of “fairness” must be met:
Pillar
Meaning
2025 Application
Procedural Equity
Fair access to the decision-making process.
Ensuring local communities have a seat at the table before a new mine or factory is approved.
Geographic Equity
Fairness in where facilities are located.
Moving away from “sacrifice zones” where polluting industries are clustered in low-income neighborhoods.
Social Equity
Ensuring that race, gender, and class do not determine environmental health.
Addressing “environmental racism,” where communities of color face higher rates of asthma and lead exposure.
2. The 2025 Reality: A Divided Landscape
The state of environmental equity at the end of 2025 is marked by a sharp divide between global progress and local setbacks:
International Progress: At the UN Climate Conference (COP30) in Brazil last month, the “Belem Package” was signed.3 For the first time, it included a historic standalone paragraph recognizing the self-determination rights of Indigenous Peoples as a cornerstone of global climate equity.
National Shifts: In the United States, 2025 has seen a significant rollback of federal environmental justice programs (such as the rescinding of the Justice40 Initiative).4 This has shifted the burden of equity work to state and local governments, who are now using their own tools like CalEnviroScreen to protect vulnerable residents.5
The “Green Premium” Gap: A major 2025 equity issue is the affordability of the green transition. Low-income families often pay a “green premium” (higher costs for EVs or solar) while bearing the brunt of rising energy prices, leading to a new form of “Energy Poverty.”
3. Environmental Equity vs. Environmental Justice
While the terms are often used interchangeably, they have distinct roles:
Environmental Equity is the Goal: A world where everyone has an equal right to a healthy environment.6
Environmental Justice is the Action: The social movement and legal work required to fix past harms and stop new ones from happening.7
4. Why It Matters: The “Economic License”
In the corporate world of late 2025, environmental equity is no longer just a moral issue; it is an operational risk.8
Stranded Assets: Companies that ignore equity—for example, by trying to build a lithium mine on sacred Indigenous land—are finding their projects blocked by litigation and community protests, turning expensive investments into “stranded assets.”9
Fiduciary Duty: Large asset managers now include “Environmental Justice Risks” in their models, recognizing that companies with poor equity records face higher insurance premiums and more regulatory hurdles.10
5. Summary: Key 2025 Equity Challenges
Urban Heat Islands: Low-income neighborhoods often have fewer trees and more concrete, making them significantly hotter during 2025’s record heatwaves.
PFAS (“Forever Chemicals”): Equity efforts this year are focused on providing clean water to rural communities whose wells have been contaminated by industrial chemicals.
The AI Footprint: The massive water and energy needs of AI data centers are creating new equity conflicts in areas where water is already scarce.
What are the environmental production possibilities?
In environmental economics, environmental production possibilities refer to the trade-offs a society faces between producing material economic goods and maintaining environmental quality.1 This is typically modeled using the Environmental Production Possibilities Frontier (PPF).
The frontier represents the maximum possible combinations of economic output (like cars, food, and electronics) and environmental quality (like clean air, biodiversity, and stable climate) that can be achieved with current technology and resources.
1. The Trade-off: Development vs. Protection
The “Environmental PPF” illustrates that resources used for economic production often degrade environmental quality, and resources used for protection (like scrubbing factory emissions) often reduce material output.
Point P (High Output, Low Protection):2 A society chooses maximum industrial growth, leading to high pollution and resource depletion.
Point T (High Protection, Low Output):3 A society prioritizes pristine nature, potentially leading to lower GDP and slower material development.
Movement Along the Curve: Moving from P toward T represents an opportunity cost: to gain a cleaner environment, the society must “pay” by producing fewer economic goods.
2. Efficiency: On vs. Inside the Curve
Productive Efficiency (On the Curve): Points on the frontier (like Q or S) are efficient.4 You cannot get more of one without sacrificing the other.
Inefficiency (Inside the Curve): A point like M (inside the curve) means the society is getting both lower output and more pollution than necessary. This often happens due to outdated technology or poorly designed regulations (command-and-control).
Improving to the Frontier: Moving from M to Q or S is a “win-win.” By adopting better technologies (like a more efficient energy grid), a country can increase its wealth without harming the environment further.
3. Shifting the Frontier in 2025
The goal of sustainable development is to shift the entire curve outward to the right.5 This makes once-impossible combinations of high wealth and high environmental health attainable.
Technological Advancement: In late 2025, innovations in Green Hydrogen and AI-optimized resource management are shifting the frontier. We can now produce the same amount of steel or cement with significantly lower $CO_2$ emissions.
The “Decoupling” Effect: If the curve shifts far enough, a country can experience economic growth while environmental degradation actually decreases. This is known as “absolute decoupling.”
Factor
Effect on the Frontier
New Clean Tech
Shifts the curve outward (more of both possible).
Natural Disaster
Shifts the curve inward (productive capacity lost).
Stricter Regulation
Moves the point along the curve (less output, more protection).
Market Inefficiency6
Keeps the society inside the curve (wasting resources).7
4. The 2025 “Hard Limit”
In 2025, scientists emphasize that the frontier has a “Planetary Boundary” or a crash point. If a society pushes too far toward “Point P” (extreme output), the resulting environmental collapse (like catastrophic climate change) can cause the entire frontier to contract sharply inward, leading to an economic and ecological depression.
Key Takeaway: The “production possibility” of the environment is not a static limit; it is a dynamic boundary that we expand through innovation but can destroy through over-exploitation.
Understanding the Production Possibilities Frontier
This video explains the fundamental economic concept of the Production Possibilities Frontier (PPF) and illustrates how technological changes can shift the maximum production levels of goods within an economy.
How does humanity transition from a growth-oriented to a balanced-oriented life-style?
Transitioning from a growth-oriented to a balanced-oriented lifestyle involves a fundamental shift in how we view the economic system and our personal habits. Instead of measuring success by accumulation and consumption, the focus moves toward resource efficiency, sharing, and sufficiency.
Here are the key ways humanity can navigate this transition, based on current economic and social movements:
1. Shift from Ownership to Access
A balanced lifestyle prioritizes access over ownership. In a growth-oriented system, we are encouraged to buy and own everything we use, which leads to “underutilized assets”—items that sit gathering dust.
The “Power Drill” Example: The average household power drill is used for only 13 minutes in its entire lifetime. By sharing tools through a Tool Library, community members can access hundreds of tools for the price of buying one.
Collaborative Consumption: Swapping, borrowing, and lending allow us to unlock the value of what we already have rather than producing new goods for every individual [07:23].
2. Move to a Circular and Use-Oriented Economy
Transitioning away from a “linear economy” (make, use, dispose) is essential to reduce environmental degradation.
Intelligent Reuse: Goods must be shared and reused to stay in the “use phase” for as long as possible.
Fighting Planned Obsolescence: By choosing shared systems, consumers can favor products with higher durability and demand items that are built to last rather than items designed to break and be replaced.
3. Redefining Prosperity and Happiness
The current growth-driven system often equates happiness with having more “stuff.” A balanced lifestyle challenges this narrative.
Breaking the Consumption Culture: Household consumption alone is responsible for roughly 60% of greenhouse gas emissions and 80% of total resource use.
From Competition to Collaboration: A balanced society shifts from individual competition and shopping toward a prosperity based on collaborating and sharing.
4. Systemic Economic Changes
A personal lifestyle shift must be supported by broader economic reforms that address the “roots” of environmental and social crises [02:19].
Addressing Negative Externalities: Many products are currently cheap because they do not include the “hidden costs” of production, such as water contamination, light pollution, and carbon emissions.
Strategic Sufficiency: This involves asking “Do I really need it?” before every purchase to ensure that consumption stays within the planet’s finite limits.
1. Problem: How do we secure critical minerals for the green transition without destroying the last untouched ecosystems?
Solution: Implement “Circular Mining” and “Urban Mining” to recover 80%+ of minerals from old electronics, while establishing a global moratorium on deep-sea mining until ecological “red lines” are scientifically defined.
2. Problem: How can we bridge the “Energy Access Gap” for the 660 million people still living in energy poverty?
Solution: Prioritize “Mission 300” (decentralized solar mini-grids) over traditional coal-fired central grids, allowing developing regions to “leapfrog” directly to clean, local energy.
3. Problem: How do we manage the massive energy and water “thirst” of AI data centers?
Solution: Mandate that all new AI infrastructure be powered by dedicated Small Modular Reactors (SMRs) or onsite renewables, and implement “closed-loop” liquid cooling to eliminate water waste.
Section 2: Economic & Lifestyle Transformation
4. Problem: How does an economy thrive if it stops growing in physical resource consumption?
Solution: Transition from GDP (Gross Domestic Product) to “Genuine Progress Indicators” (GPI) that value unpaid care work, leisure time, and ecosystem health.
5. Problem: How do we eliminate “Planned Obsolescence” in a profit-driven market?
Solution: Enact “Right to Repair” laws and “Extended Producer Responsibility” (EPR), where manufacturers are legally and financially responsible for a product’s entire lifecycle, including its eventual recycling.
6. Problem: How do we solve the “Housing vs. Habitat” conflict in growing cities?
Solution: Focus on “Vertical Urbanism” and “Infill Development” (building on underused urban land) rather than “Sprawl,” while mandating that 30% of all urban space be preserved as “Biophilic” green corridors.
Section 3: Environmental Protection & Equity
7. Problem: How do we stop “Environmental Racism” where pollution is clustered in low-income areas?
Solution: Use “Equity Screening Tools” to block any new industrial permits in “overburdened” communities and redirect 40% of green investments (like the Justice40 framework) to these specific zones.
8. Problem: How do we feed 8 billion people without depleting the world’s remaining topsoil?
Solution: Scale “Regenerative Agriculture” (no-till farming and cover cropping) and “Agroforestry” to restore soil carbon and water retention while reducing synthetic fertilizer runoff.
9. Problem: How do we protect 30% of the ocean (the “30 by 30” goal) when most of it is “International Waters”?
Solution: Fully ratify and enforce the UN High Seas Treaty, creating a global “Blue Police” force to monitor and ban industrial fishing and mining in protected marine sanctuaries.
Section 4: The Human & Social Dimension
10. Problem: How do we prevent a “Climate Migration” crisis from becoming a geopolitical conflict?
Solution: Establish a “Global Climate Refugee Passport” and a dedicated UN fund to support “Managed Retreat”—helping coastal communities move inland before disaster strikes.
11. Problem: How do we combat “Information Pollution” (AI-driven misinformation) that prevents climate action?
Solution: Implement “Digital Provenance” standards (watermarking AI content) and increase funding for independent, science-based “Information Integrity” agencies.
12. Problem: How do we solve “Energy Poverty” in the West as electricity prices rise during the transition?
Solution: Roll out universal “Heat Pump” subsidies and “Community Solar” programs that allow renters and low-income homeowners to benefit from free energy without high upfront costs.
Section 5: Systemic Global Solutions
13. Problem: How do we ensure that “Green Patents” don’t prevent developing nations from transitioning?
Solution: Create a “Global Green Patent Pool” where critical climate technologies (like high-efficiency batteries) are licensed at low or zero cost to low-income countries.
14. Problem: How do we stop “Carbon Leakage” (companies moving to countries with weak environmental laws)?
Solution: Implement “Carbon Border Adjustment Mechanisms” (CBAM)—a tax on imported goods based on their carbon footprint, forcing all global trade to play by the same environmental rules.
15. Problem: How do we fund the trillions needed for this transition without bankrupting the Global South?
Solution: Implement a “Global Wealth Tax” on the top 0.1% and a “Polluter Pays” levy on the windfall profits of fossil fuel companies to create a $1 trillion annual “Loss and Damage” fund.