
Meteorology Today Second Canadian Edition
Earth and Atmospheric Sciences
Think of air as more than just “empty space.” We’re actually living at the bottom of a massive ocean of gases. Here is the breakdown of how that weight affects us and how it gets the atmosphere moving.
What is Air Pressure?
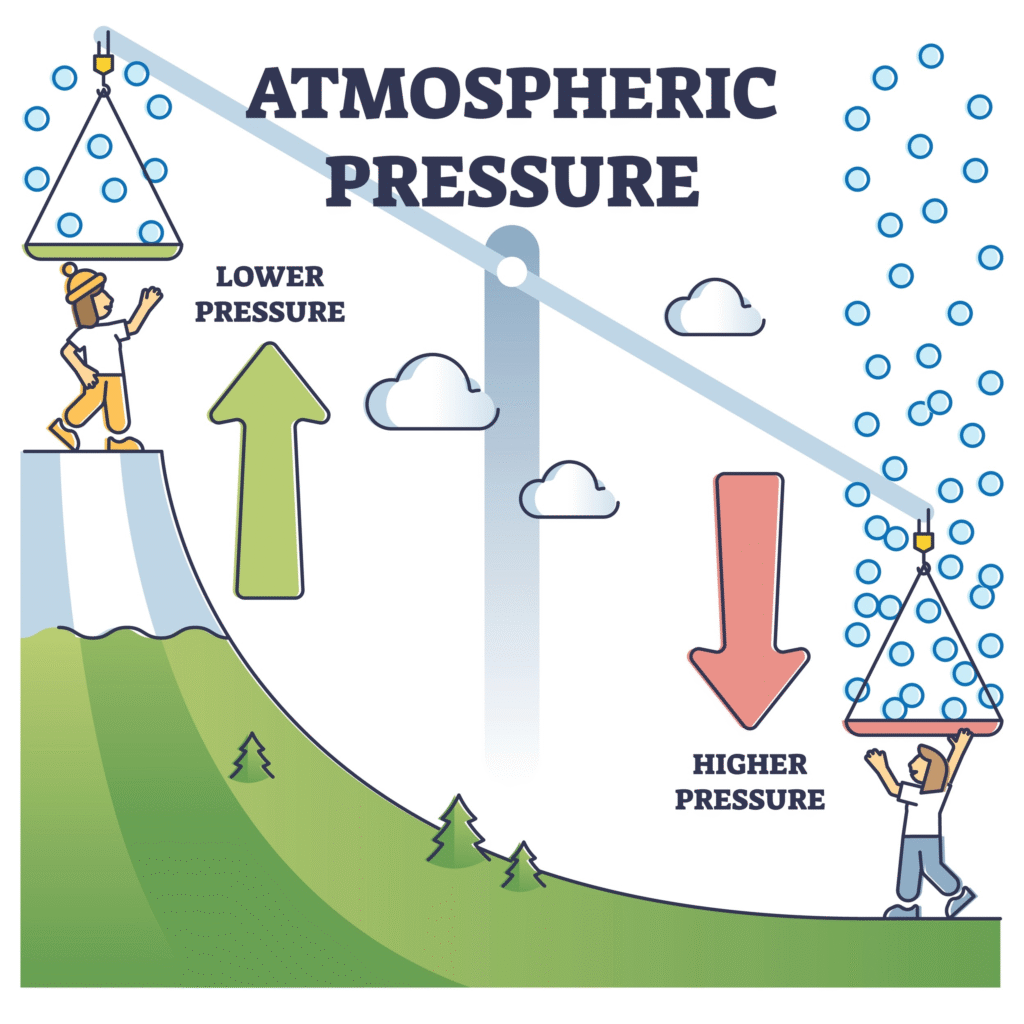
Air pressure is the weight of the atmosphere pressing down on the Earth. Even though air feels light, the molecules (mostly nitrogen and oxygen) have mass. Gravity pulls these molecules toward the center of the Earth, creating a constant force.
At sea level, the average air pressure is about 14.7 pounds per square inch (psi). You don’t feel it because the fluids inside your body are pushing back with the same amount of force.
Why it Changes
- Altitude: The higher you go (like climbing a mountain), the fewer air molecules there are above you. This means the pressure drops.
- Temperature: Warm air expands and becomes less dense, leading to low pressure. Cold air is dense and sinks, creating high pressure.
What Causes Wind?
In short: Wind is nature’s attempt to balance out horizontal differences in air pressure. Air always moves from areas of high pressure to areas of low pressure. Think of it like a balloon: if you inflate a balloon (high pressure) and let go of the end, the air rushes out toward the room (lower pressure).
The Three Main Ingredients
- Uneven Heating: The sun heats the Earth unevenly. The equator receives direct sunlight and stays warm (low pressure), while the poles receive slanted light and stay cold (high pressure).
- Pressure Gradient Force: This is the “push” that sends air moving from the cold, dense high-pressure zones toward the warm, rising low-pressure zones. The bigger the difference in pressure, the faster the wind blows.
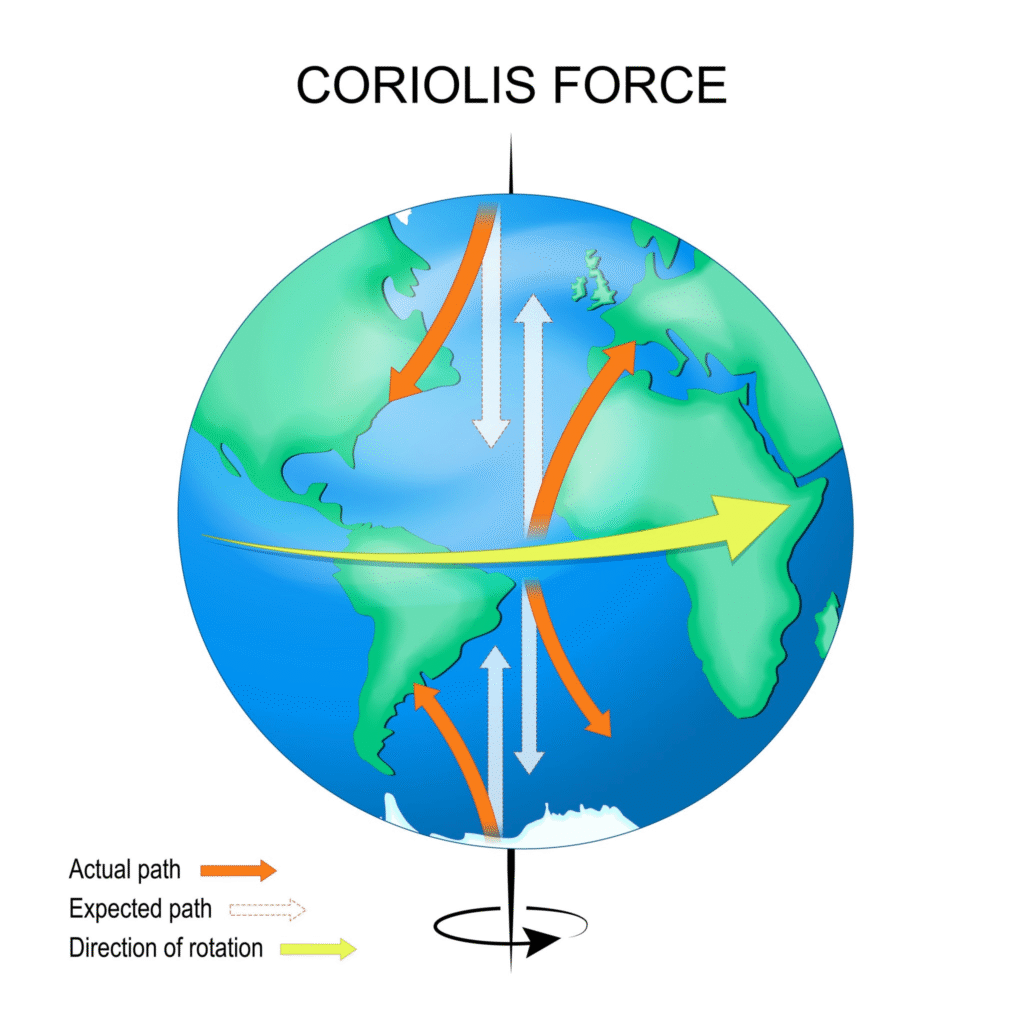
- The Coriolis Effect: Because the Earth is rotating, wind doesn’t travel in a straight line. In the Northern Hemisphere, it curves to the right; in the Southern Hemisphere, it curves to the left. This creates the circular patterns we see in weather maps.
Summary Table: High vs. Low Pressure
| Feature | High Pressure (Anticyclone) | Low Pressure (Cyclone) |
| Air Movement | Sinking air | Rising air |
| Wind Direction | Outward (clockwise in N. Hemisphere) | Inward (counter-clockwise in N. Hemisphere) |
| Weather | Usually clear and sunny | Usually cloudy and rainy |
Fun Fact: The fastest winds on Earth (outside of tornadoes) are found in the Jet Stream, which are narrow bands of strong wind in the upper atmosphere caused by the massive temperature difference between the poles and the equator.
What is atmospheric pressure?
Think of atmospheric pressure as the weight of the sky pressing down on you. Even though air feels like “nothing,” it is made of gas molecules that have actual mass.
Because gravity pulls everything toward the center of the Earth, it creates a massive “pile” of air molecules surrounding our planet. Atmospheric pressure is simply the force exerted by the weight of those molecules as they press against a surface.
How it Works
Imagine you are standing at the bottom of a swimming pool. You feel the weight of the water pressing on you from all sides. We live at the bottom of an “ocean” of air about 300 miles (480 km) deep.
- At Sea Level: You have the maximum amount of air stacked above you. The pressure is roughly 14.7 pounds per square inch (psi), or about 1,013.25 millibars.+1
- At High Altitudes: If you climb a mountain, there is less air above you. Because there are fewer molecules to press down, the atmospheric pressure drops. This is why bags of chips puff up when you drive into the mountains—the air inside the bag is pushing out harder than the “thin” mountain air is pushing in.
Why Don’t We Get Crushed?
If there are nearly 15 pounds of pressure hitting every square inch of your body, you might wonder why you don’t collapse like an empty soda can.
The reason is internal balance. The fluids (like blood) and gases inside your body are pushing outward with the same pressure that the atmosphere is pushing inward. They cancel each other out perfectly. You only notice the difference when that balance shifts—like when your ears “pop” on a plane as they try to equalize the pressure.
Measuring Pressure
Scientists use an instrument called a barometer to measure these changes.
- High Pressure: Usually means the air is sinking. This prevents clouds from forming, leading to clear, sunny skies.
- Low Pressure: Usually means air is rising. As it rises, it cools and condenses, leading to clouds and rain.
Quick Comparison: Altitude and Pressure
| Location | Air Density | Pressure Level |
| Dead Sea (Below Sea Level) | Very High | Maximum |
| Beach (Sea Level) | High | Standard (1 atm) |
| Mt. Everest Peak | Very Low | ~1/3 of Sea Level |
What is horizontal pressure variations?
While atmospheric pressure always drops as you go up, horizontal pressure variation refers to the difference in air pressure between two different locations at the same altitude (usually measured at sea level).
These differences are the “engine” of our atmosphere. If pressure were the same everywhere horizontally, the air would be perfectly still and we would have no weather.
What Causes These Variations?
Horizontal differences are primarily driven by two factors: Temperature and Earth’s Rotation.
1. Thermal Factors (The Sun)
The sun doesn’t heat the Earth evenly.
- Warm Areas: When air stays over a warm surface (like the equator), it expands, becomes less dense, and rises. This creates a Low Pressure zone at the surface.
- Cold Areas: Over cold surfaces (like the poles), air cools, becomes dense, and sinks. This “piles up” air at the surface, creating a High Pressure zone.
2. Dynamic Factors (Air Movement)
Sometimes, air is forced to rise or sink due to the way it flows in the upper atmosphere.
- Convergence: When air flows together in the upper atmosphere, it is forced downward, increasing surface pressure.
- Divergence: When air spreads apart aloft, it “pulls” air up from the surface, lowering the pressure.
The Result: The Pressure Gradient
The difference in pressure between two points is called the Pressure Gradient. On a weather map, you see this represented by isobars (lines connecting points of equal pressure).
- Steep Gradient: When isobars are packed closely together, the pressure change is rapid over a short distance. This results in strong, high-speed winds.
- Weak Gradient: When isobars are far apart, the pressure change is gradual. This results in light breezes or calm air.
Why It Matters: The “Wind Push”
Horizontal pressure variation creates the Pressure Gradient Force (PGF). This force acts like a cosmic “nudge,” pushing air directly from the High-pressure area toward the Low-pressure area.
| Feature | High Pressure Center | Low Pressure Center |
| Scientific Name | Anticyclone | Cyclone |
| Air Density | More Dense (Heavier) | Less Dense (Lighter) |
| Horizontal Flow | Air flows away from the center | Air flows toward the center |
A Simple Mathematical View
In meteorology, the horizontal pressure gradient (G) can be represented by the change in pressure (dp) over a change in distance (dx):
Where ρ is the air density. This shows that the force is always directed from high to low pressure.
What are daily pressure variations?
Beyond the big changes caused by moving weather systems (like storms), air pressure actually “breathes” on its own every day. These small, rhythmic pulses are called daily (or diurnal) pressure variations.+1
They are essentially atmospheric tides. Just as the moon pulls the ocean, the sun “pulls” the atmosphere—not just with gravity, but primarily with heat.+1
The Daily Cycle: Two Highs and Two Lows
In a stable environment (especially in the tropics), you would notice that the barometer rises and falls in a predictable 12-hour cycle, known as the semidiurnal oscillation.
- Peak Highs: Around 10:00 AM and 10:00 PM local time.
- Deep Lows: Around 4:00 AM and 4:00 PM local time.
Why does this happen?
- Solar Heating: As the sun heats the atmosphere during the day, the air expands. This doesn’t just happen at the surface; ozone and water vapor in the upper atmosphere absorb solar radiation, causing the air to expand and “bulge” outward.+1
- Pressure Waves: This expansion creates a global wave that travels around the Earth, following the sun. Because the atmosphere is a fluid, this wave reflects and resonates, resulting in two distinct pressure “bulges” on opposite sides of the planet.
- Atmospheric Resonance: The atmosphere happens to be “tuned” in a way that it responds more strongly to a 12-hour cycle (semidiurnal) than a 24-hour one.
Where is it most noticeable?
- The Tropics: Near the equator, these variations are very consistent (about 3 millibars of change). Sailors in the tropics can actually use their barometers to tell the time because the cycle is so regular!
- Mid-Latitudes: In places like the U.S., Europe, or Canada, these daily “tides” are often hidden by much larger pressure changes from passing cold fronts and storm systems.
Summary of Daily Changes
| Time of Day | Pressure Trend | Reason |
| Morning (10 AM) | High | Air is relatively cool and stable after the night. |
| Afternoon (4 PM) | Low | Maximum solar heating causes air to expand and lift. |
| Evening (10 PM) | High | Air cools and “piles up” as it settles. |
| Pre-dawn (4 AM) | Low | Part of the global resonance/tidal wave cycle. |
Note: If you are tracking a storm, you have to “filter out” this daily wobble. If the pressure is dropping at 4:00 PM, it might just be the daily cycle. But if the pressure is dropping at 10:00 AM (when it should be rising), a real storm is likely approaching.
How is pressure measured?
To measure something as invisible as air, we have to look at how it pushes against other objects. Scientists use a variety of tools depending on whether they need extreme precision or something that fits inside a smartphone.
The primary instrument for measuring atmospheric pressure is the barometer.
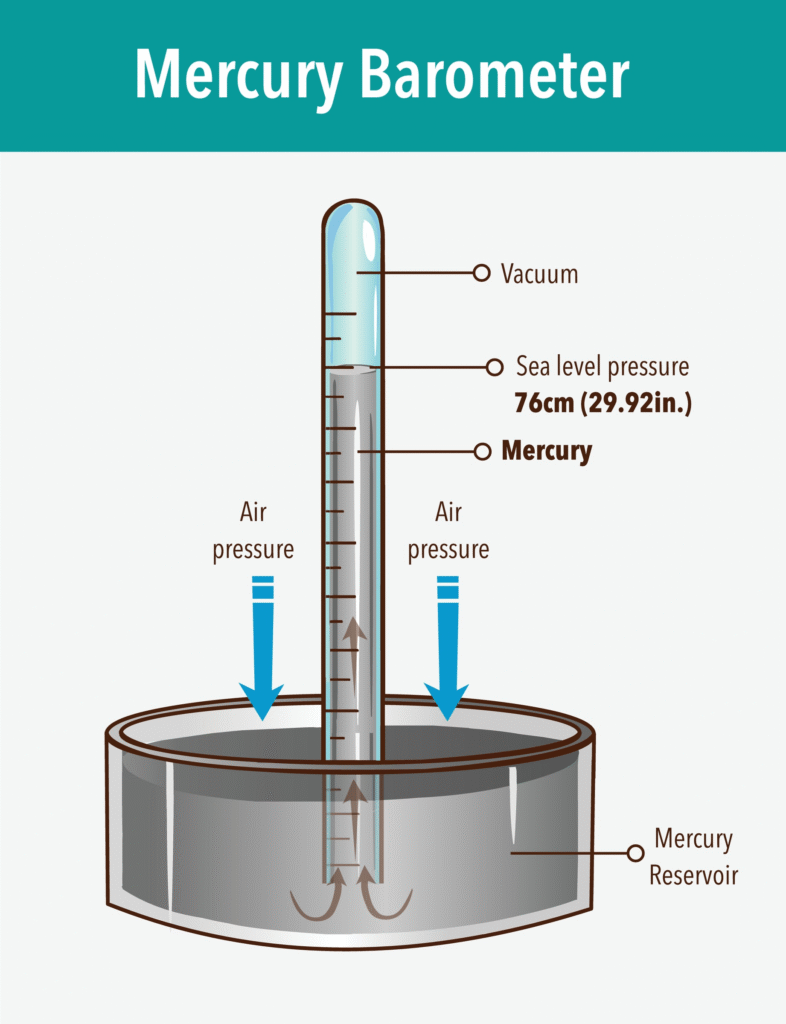
1. The Mercury Barometer (The Classic)
Invented by Evangelista Torricelli in 1643, this is the “gold standard” for accuracy. It consists of a glass tube closed at the top and open at the bottom, sitting in a pool of mercury.
- How it works: The weight of the atmosphere presses down on the pool of mercury, which forces the liquid up into the tube.
- The Reading: At sea level, the air is heavy enough to push the mercury exactly 760 millimeters (29.92 inches) up the tube. When a storm approaches (low pressure), the air pushes less, and the mercury level drops.
2. The Aneroid Barometer (The Mechanical)
Since mercury is toxic and glass tubes are breakable, most wall-mounted barometers use “aneroid” (meaning “without liquid”) technology.
- How it works: Inside the device is a small, flexible metal box called an aneroid cell. Most of the air has been pumped out of it.
- The Movement: When air pressure increases, the box squashes inward. When pressure decreases, the box expands. A series of springs and levers translates this tiny movement into a needle moving across a dial.
3. Digital and MEMS Sensors (The Modern)
Your smartphone, smartwatch, and digital weather stations use MEMS (Micro-Electro-Mechanical Systems).
- How it works: These are tiny silicon chips with a pressure-sensitive diaphragm. As the air pressure changes, it alters the electrical properties (like resistance or capacitance) of the chip.
- Utility: These are incredibly small and allow your phone to detect if you’ve walked up a flight of stairs by sensing the tiny drop in air pressure.
Common Units of Measurement
Depending on where you live or what you are doing (flying a plane vs. watching the news), you will see pressure expressed in different units:
| Unit | Common Use | Standard Sea Level Value |
| Millibars (mb) | Meteorology / Weather Maps | 1013.25 mb |
| Hectopascals (hPa) | International Scientific Standard | 1013.25 hPa |
| Inches of Mercury (inHg) | Aviation and US Weather Reports | 29.92 inHg |
| Pounds per Sq. Inch (psi) | Tire pressure / Industrial | 14.7 psi |
The Barograph: Recording Pressure Over Time
A barograph is simply an aneroid barometer connected to a pen and a rotating drum of paper. It creates a continuous “map” of pressure changes over days or weeks. This is how sailors and meteorologists see if the pressure is falling slowly (a light change) or “falling off a cliff” (a major storm incoming).
Does the atmosphere obey the gas law?
The short answer is yes, but with a few real-world “asterisks.”
The atmosphere follows the Ideal Gas Law, which describes the relationship between pressure, density, and temperature. In meteorology, we use a specific form of this equation to understand how air behaves as it moves and changes altitude.
1. The Mathematical Relationship
The state of the atmosphere is governed by the formula:
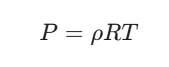
Where:
- P is Atmospheric Pressure.
- ρ (rho) is the Density of the air.
- R is the Specific Gas Constant for dry air (287 J/kg•K).
- T is the Absolute Temperature (measured in Kelvin).
What this tells us:
- If Temperature (T) increases (and pressure stays the same), Density (ρ) must decrease. This is why hot air rises—it becomes less dense than the air around it.
- If Density (ρ) increases (air is squeezed together), Pressure (P) increases. This is what happens when you pump up a bicycle tire.
2. Why the Atmosphere is “Almost” Ideal
The Ideal Gas Law assumes that gas molecules don’t attract each other and take up zero space. While air molecules do have volume and subtle attractions, the atmosphere is “thin” enough that the Ideal Gas Law is incredibly accurate for almost all weather calculations.
However, there are two main reasons the atmosphere is more complex than a gas in a laboratory:
A. Water Vapor (The “Rule Breaker”)
The gas law above is for dry air. Moist air behaves differently because water vapor is lighter than nitrogen and oxygen.
- Fact: Humid air is actually less dense than dry air at the same temperature.
- To fix this, meteorologists use Virtual Temperature, a “fake” temperature that accounts for moisture so they can keep using the standard gas law.
B. Gravity and Hydrostatic Balance
In a lab, gas is usually in a small container where gravity doesn’t matter much. In the atmosphere, gravity is constantly pulling those molecules down.
The atmosphere obeys the Hydrostatic Equation, which balances the downward pull of gravity against the upward push of the pressure gradient:
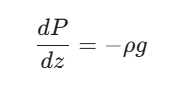
This explains why pressure decreases so rapidly as you go up (z); the weight of the air above is simply gone.
3. Practical Examples in Nature
- Adiabatic Cooling: When a parcel of air rises (like up a mountain), the surrounding pressure (P) drops. According to the gas law, the air expands and the temperature (T) must drop. This is why mountain tops are snowy even in summer.
- Heat Bursts: Conversely, when air sinks rapidly, it is compressed by higher pressure. This compression forces the temperature to spike, sometimes creating “heat bursts” where the temperature on the ground rises 20 degrees in minutes.
Comparison: Ideal vs. Real Atmosphere
| Feature | Ideal Gas Assumption | Real Atmosphere Reality |
| Composition | Pure, single gas | Mix of N2, O2, Ar, and variable H2O |
| Volume | Particles have no volume | Particles have tiny but real volume |
| Gravity | Negligible | Critical (creates the pressure gradient) |
| Temperature | Uniform | Varies wildly by layer (Troposphere, Stratosphere, etc.) |
What are pressure readings?
pressure readings are the specific numerical values recorded by a barometer that tell us the “weight” of the air at a given moment. However, a raw reading from a barometer isn’t very useful on its own—it has to be adjusted to make sense for weather forecasting.
There are two main types of pressure readings you will encounter:
1. Station Pressure (The Raw Reading)
This is the actual air pressure measured at a specific location, exactly where the barometer is sitting.
- The Problem: If you have a weather station on a mountain and one at the beach, the mountain station will always show a lower pressure because there is less air above it.
- Use Case: Station pressure is mostly used for local industrial purposes or by scientists studying a specific high-altitude environment.
2. Sea-Level Pressure (The Adjusted Reading)
To compare weather between different cities, meteorologists must “level the playing field.” They take the Station Pressure and mathematically calculate what the pressure would be if that station were located at sea level.
- Why it matters: By removing the effect of altitude, we can see the horizontal pressure variations caused by weather systems. This allows us to draw isobars (lines of equal pressure) on a map to find Highs and Lows.
- Standard Sea Level Pressure: 1013.25 mb (or 29.92 inHg).
3. Altimeter Setting (Aviation Reading)
Pilots use a specific type of pressure reading called an Altimeter Setting.
- Because air pressure changes with altitude, a pilot’s altitude gauge (which is actually just a fancy barometer) would be wrong if they didn’t update it.
- Controllers give pilots the current local pressure reading so they can “zero out” their instruments and ensure they aren’t flying too low.
How to Interpret a Pressure Reading
When you look at a barometer, the trend (the change over time) is usually more important than the single number itself.
| Reading Trend | What it usually means |
| Rising Rapidly | A high-pressure system is moving in; expect clearing skies and cooler, drier air. |
| Steady | Current weather conditions are likely to persist. |
| Falling Slowly | A low-pressure system or warm front is approaching; clouds are likely. |
| Falling Rapidly | A significant storm, cold front, or “line” of thunderstorms is imminent. |
Summary of Common Values
- Extremely High: Over 1040 mb (Strong Arctic high pressure, very clear/cold).
- Average: Around 1013 mb.
- Extremely Low: Below 980 mb (Strong storm or hurricane).
- The lowest pressure ever recorded (non-tornadic) was 870 mb inside Typhoon Tip.
What are surface and upper-level charts?
To understand the atmosphere, meteorologists look at it in 3D. Since the air at the ground behaves differently than the air five miles up, they use two distinct types of maps: Surface Charts and Upper-Level Charts.
1. Surface Charts
A surface chart (also called a “surface analysis”) shows weather conditions at the Earth’s surface. This is the map you typically see on the evening news.
- What it shows: High (H) and Low (L) pressure centers, fronts (cold, warm, stationary), and isobars (lines of equal pressure).
- Constant Variable: Altitude. All data is adjusted to Sea Level.
- What we learn: It tells us where it is currently raining, where the wind is blowing at the ground, and where air masses are colliding.
2. Upper-Level Charts (Constant Pressure Charts)
Upper-level charts are different because they don’t look at a specific altitude. Instead, they look at a specific pressure level (like 500 mb) and map how high you have to go to find it.
Imagine the atmosphere as a layer of “invisible hills.” In warm areas, the air expands and the 500 mb level is high up. In cold areas, the air shrinks and that level is closer to the ground.
- What it shows: Height Contours (instead of isobars), Troughs (dips in the air), and Ridges (humps in the air).
- Constant Variable: Pressure. (e.g., the 300 mb, 500 mb, or 850 mb map).
- What we learn: These maps show the Jet Stream. They tell us where storms will move in the future, as the upper-level winds “steer” the surface weather.
Key Differences at a Glance
| Feature | Surface Chart | Upper-Level Chart |
| Map Type | Constant Altitude (Sea Level) | Constant Pressure (e.g., 500 mb) |
| Lines Drawn | Isobars (Equal Pressure) | Isohypses (Equal Height) |
| Wind Behavior | Winds cross isobars due to friction | Winds blow parallel to heights (Geostrophic) |
| Primary Goal | Current weather & fronts | Steering patterns & “The Big Picture” |
Why Use Both?
The relationship between these two maps is the secret to forecasting:
- Divergence aloft: If the upper-level air spreads out (divergence), it “sucks” air up from the surface like a vacuum.
- Surface Response: This creates a Low Pressure system at the surface, leading to storms.
- The Result: Without looking at the upper-level chart, a meteorologist wouldn’t know if a surface Low is going to get stronger or fizzle out.
[Image showing the relationship between upper-level divergence and surface low pressure]
Common Upper-Level Levels
- 850 mb (~5,000 ft): Used to find the “Low-Level Jet” and moisture transport.
- 500 mb (~18,000 ft): The “steering level” for most weather systems.
- 300 mb 250 mb (~30,000+ ft): Used to locate the core of the Jet Stream.
What do we observe as a plane fly from high pressure to low pressure?
When a plane flies from an area of high pressure to an area of low pressure, the most critical observations involve the altimeter (the instrument that tells the pilot their height) and the wind patterns.
In aviation, there is a famous rule of thumb: “From High to Low, Look out Below.” Here is why.
1. The Altimeter “Error”
An altimeter is actually just a very sensitive barometer. It assumes that a certain air pressure corresponds to a certain altitude.
- The Problem: In a low-pressure area, the air is thinner/less dense. The altimeter “sees” this lower pressure and thinks the plane has climbed higher into the sky.
- The Result: To stay at what it thinks is the correct altitude (e.g., 5,000 feet), the altimeter will show the plane is too high. If the pilot follows the needle and descends to “fix” it, the plane will actually be flying at a lower true altitude than the instrument says.
Observation: If the pilot doesn’t update the altimeter setting, the plane will be closer to the ground (or mountains) than the gauge indicates.
2. Changes in Wind (The Drift)
Because wind flows around pressure systems in predictable ways, a pilot will notice a shift in how the plane is being “pushed.”
- In the Northern Hemisphere: Air flows clockwise around Highs and counter-clockwise around Lows.
- The Transition: As you move toward the center of a Low, you will typically experience an increasing left-hand drift (a crosswind pushing you from the left) or a shift toward a headwind.
- The Observation: The pilot has to “crab” the plane (angle the nose) to stay on the intended flight path.
3. Changing Weather Conditions
As the plane moves from a High to a Low, the visual environment usually shifts significantly:
- From the High: You likely started in clear skies, calm air, and excellent visibility.
- Approaching the Low: You will observe a gradual increase in cloud cover. Usually, you see high-level cirrus clouds first, followed by thickening and lowering clouds (altostratus or nimbostratus).
- Into the Low: You are more likely to encounter turbulence (due to rising air currents), precipitation, and lower visibility.
Summary Table: High to Low Transition
| Observation | High Pressure Area | Transitioning to Low |
| True Altitude | Matches Altimeter | Lower than Altimeter |
| Sky Condition | Clear / Scattered clouds | Increasing, lowering clouds |
| Air Stability | Stable (Smooth air) | Unstable (Potential turbulence) |
| Wind | Light / Variable | Strengthening / Shifting |
A Simple Math Perspective
If the sea-level pressure drops by 1 inch of mercury (inHg), your altimeter will be off by approximately 1,000 feet. If you don’t adjust your settings, you could be 1,000 feet closer to the trees than you realize!
How does Newton’s laws and forces describe atmospheric motion?
Atmospheric motion is essentially a giant physics problem. While we often talk about “the weather,” meteorologists look at the atmosphere as a fluid governed by Newton’s Second Law of Motion: $F = ma$.
In the atmosphere, this is expressed as the Equations of Motion. To describe why air moves (acceleration), we have to look at the sum of the forces acting upon it.
1. Newton’s Second Law (F = ma)
In our atmosphere, the “acceleration” (a) of an air parcel is the result of several competing forces (F) divided by the mass of the air.
The primary forces are:
- Pressure Gradient Force (PGF)
- Coriolis Force
- Friction
- Gravity
The Pressure Gradient Force (The “Starter”)
This is the fundamental force that gets air moving. As Newton’s law suggests, an object will stay at rest unless acted upon by a force. When there is a difference in pressure over a distance, air is pushed from High to Low.
- Rule: The steeper the pressure change, the greater the force, and the faster the air accelerates.
2. The Coriolis Force (The “Steerer”)
Once Newton’s “Starter” force gets the air moving, the Coriolis Force takes over as a “steering” force. This is an apparent force caused by the Earth’s rotation.
- Application: It doesn’t change the speed of the wind, but it changes the direction.
- Result: In the Northern Hemisphere, it deflects air to the right. This prevents air from flowing directly into the center of a Low, creating the circular wind patterns we see on maps.+1
3. Geostrophic Balance (Newton’s First Law)
Newton’s First Law states that an object will move at a constant velocity if the net force is zero. In the upper atmosphere (away from the ground), a state of equilibrium is often reached between the PGF and the Coriolis Force.
This is called Geostrophic Wind.
- The PGF pulls the air toward the Low.
- The Coriolis Force pulls it exactly in the opposite direction.
- The air ends up moving in a straight line, parallel to the isobars.
4. Friction (The “Slower”)
Newton’s laws also account for resistance. Near the Earth’s surface, the terrain (trees, mountains, buildings) acts as a frictional force.+1
- Effect: Friction slows the wind down.
- The Chain Reaction: Because the wind slows down, the Coriolis Force (which depends on speed) weakens.
- Result: The Pressure Gradient Force “wins” slightly, causing the wind at the surface to blow across the isobars and spiral inward toward the Low.
5. Gravity and Hydrostatic Balance
For vertical motion, we look at the balance between the upward Pressure Gradient Force and the downward pull of Gravity.
- When these two are equal, we have Hydrostatic Balance.
- The atmosphere obeys this balance about 99% of the time. When it doesn’t (when the upward force is much stronger), we get violent vertical accelerations, such as thunderstorms and tornadoes.
Summary Table of Forces
| Force | Direction | Effect on Motion |
| PGF | High → Low | Initiates all wind; determines speed. |
| Coriolis | Right of motion (NH) | Changes direction; increases with speed. |
| Friction | Opposite of motion | Slows wind; occurs only near surface. |
| Gravity | Downward | Balances vertical pressure; keeps atmosphere attached. |
What is the relationship between forces and horizontal winds?
The relationship between forces and horizontal winds is a balancing act. In physics terms, wind is the atmosphere’s response to a net force acting on an air parcel. If there were no forces, the air would be stagnant; instead, several forces compete to determine the wind’s speed and direction.
To understand horizontal winds, we look at how three primary forces interact.
1. The Pressure Gradient Force (PGF): The “Engine”
This is the fundamental force that causes wind to blow in the first place. It is caused by the difference in barometric pressure between two points.
- Direction: Always moves directly from High Pressure toward Low Pressure.
- Relationship to Wind Speed: The “steeper” the gradient (how quickly pressure changes over distance), the stronger the force. On a weather map, this is shown by how closely the isobars are spaced.
2. The Coriolis Force: The “Steer”
Once the PGF gets the air moving, the Earth’s rotation creates an “apparent” force that deflects the wind.
- Direction: In the Northern Hemisphere, it pulls wind to the right. In the Southern Hemisphere, to the left.
- Relationship to Wind Speed: The faster the wind blows, the stronger the Coriolis deflection becomes.
- Note: This force is zero at the equator and strongest at the poles.
3. The Resulting Wind Patterns
The way these forces interact depends on whether you are high in the sky or down at the surface.
A. Upper-Level Winds (Geostrophic Balance)
High above the Earth (above 3,000 feet), there is no friction. Eventually, the PGF pulling air toward the low and the Coriolis Force pulling air to the right reach an equilibrium.
- The Result: The wind stops moving toward the low and instead blows parallel to the isobars. This is called Geostrophic Wind.
B. Surface Winds (The Friction Factor)
Near the ground, trees, mountains, and buildings create Friction.
- Friction slows the wind speed down.
- Because the wind is slower, the Coriolis Force weakens.
- The Pressure Gradient Force “wins” the tug-of-war, pulling the wind slightly across the isobars.
- The Result: Surface winds spiral inward toward Lows and outward away from Highs.
Summary Table: Force Interaction
| Force | Primary Role | Impact on Wind |
| Pressure Gradient (PGF) | The Trigger | Determines the initial speed and direction. |
| Coriolis | The Redirector | Changes the direction (right in NH) but not the speed. |
| Friction | The Brake | Slows the wind and causes it to cross isobars toward Lows. |
| Centrifugal | The Curve | Acts when wind travels in a curved path (like around a storm). |
Why this matters for forecasting
By looking at the “tightness” of the isobars (PGF) and accounting for the Earth’s rotation (Coriolis), meteorologists can calculate exactly how fast the wind will blow before a single breeze is felt on the ground.
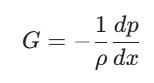
What is the pressure gradient force?
The Pressure Gradient Force (PGF) is the fundamental force that triggers the movement of air (wind). In physics terms, it is the force that results when there is a difference in pressure across a surface or between two locations.
Think of it as the “push” that starts the engine of the atmosphere.
1. How It Works: High to Low
The atmosphere is always seeking balance (equilibrium). If one area has high pressure (dense, heavy air) and an adjacent area has low pressure (less dense, lighter air), the high-pressure air will naturally rush toward the low-pressure area to fill the gap.
- Direction: The PGF always acts at a right angle (perpendicular) to the isobars (lines of constant pressure).
- Vector: It points directly from High to Low.
2. Gradient “Steepness” and Wind Speed
The strength of the PGF is determined by the Pressure Gradient, which is the change in pressure divided by the distance.
- Steep Gradient: When isobars are packed very closely together on a map, the pressure is changing rapidly over a short distance. This creates a strong PGF and results in high wind speeds.
- Weak Gradient: When isobars are spread far apart, the pressure change is gradual. This creates a weak PGF and results in light breezes.
3. The Mathematical Definition
In a simple horizontal dimension (x), the pressure gradient force per unit mass is expressed as:
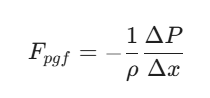
Where:
- ρ (rho): Is the density of the air.
- ΔP: Is the change in pressure.
- Δx: Is the distance between the two points.
The negative sign indicates that the force moves away from the higher pressure. This formula shows that for the same pressure difference, colder, denser air (ρ) will accelerate more slowly than warmer, thinner air.
4. Why doesn’t air blow directly into a Low?
If the PGF were the only force acting on the air, wind would always blow in a straight line from High to Low. However, because the Earth rotates, the Coriolis Force begins to pull the air to the side as soon as it starts moving.
At the surface, Friction also gets involved. The wind we actually feel is the result of the PGF “fighting” against these other forces.
Summary: The PGF Profile
| Characteristic | Description |
| Origin | Temperature differences causing density/pressure changes. |
| Primary Function | To initiate air motion (it is the “starter” force). |
| Map Appearance | Perpendicular to isobars; strongest where lines are tightest. |
| Vertical Aspect | Also exists vertically, but is mostly balanced by gravity. |
What is the Coriolis force?
The Coriolis force is an “apparent” or “fictional” force that arises because we are observing motion from a rotating frame of reference—the Earth. It doesn’t actually “push” the air in a physical sense like a hand pushes a ball; rather, it is the result of the Earth spinning beneath the air while the air tries to move in a straight line.
If you were looking down at Earth from space, you would see the air moving straight. But to us standing on the spinning ground, it looks like the air is curving.
1. How It Works
Imagine you are standing at the center of a merry-go-round and you throw a ball to a friend on the edge. While the ball is in the air, the friend rotates away from the spot where you aimed. To your friend, it looks like the ball “curved” away from them.
On Earth, this happens because different parts of the planet rotate at different speeds:
- The Equator: Spins very fast (about 1,000 mph) because it has to cover a large circumference in 24 hours.
- The Poles: Have almost zero rotational speed; they just spin in place.
When air moves from the fast-spinning equator toward the slower-spinning poles, it maintains its initial momentum and ends up “getting ahead” of the ground below it, creating a curve.
2. The Rules of the Coriolis Force
There are three main “laws” that govern how this force behaves in our atmosphere:
- Direction of Deflection:
- In the Northern Hemisphere, air is always deflected to the right of its path of motion.
- In the Southern Hemisphere, air is always deflected to the left.
- Speed Dependency: The force is proportional to wind speed. The faster the wind blows, the stronger the Coriolis deflection becomes. It cannot start a wind (only the Pressure Gradient Force can do that), but it can certainly steer it.
- Latitude Dependency: The force is strongest at the Poles and decreases to zero at the Equator. This is why hurricanes (which need the Coriolis force to spin) almost never form within 5 degrees of the equator.
3. The Mathematical View
For those who like the physics, the Coriolis acceleration (ac) is calculated as:
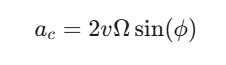
Where:
- v is the wind speed.
- ω is the angular velocity of Earth’s rotation.
- φ is the latitude.
The sin(φ) term is what causes the force to disappear at the equator (sin(0) = 0) and peak at the poles (sin(90) = 1).
4. Real-World Impact: The “Spin” of Storms
The Coriolis force is responsible for the circular rotation of large weather systems.
- Low Pressure (Cyclones): As the Pressure Gradient Force pulls air inward toward a Low, the Coriolis force pulls it to the right. These competing forces result in a counter-clockwise spin in the Northern Hemisphere.
- High Pressure (Anticyclones): Air pushing outward is deflected to the right, creating a clockwise spin.
Common Myth: Toilets and Sinks
You may have heard that the Coriolis force determines which way water drains in a toilet. This is a myth. The Coriolis force is very weak; it only affects large-scale movements (like hundreds of miles of air). In a small sink or toilet, the shape of the basin and the direction the water entered have a much stronger influence than the Earth’s rotation.
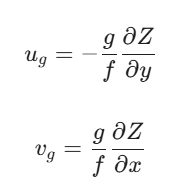
What are geostrophic winds?
A geostrophic wind is a theoretical wind that results from a perfect balance between the Pressure Gradient Force (PGF) and the Coriolis Force.
In the real world, this occurs mostly in the upper atmosphere (above 3,000 feet), where the air is far enough away from the Earth’s surface to avoid the “drag” of friction.
1. The “Tug-of-War” Balance
To understand how a geostrophic wind forms, imagine a parcel of air starting to move:
- The Start: The Pressure Gradient Force (PGF) pushes an air parcel directly toward an area of Low Pressure.
- The Turn: As the air gains speed, the Coriolis Force begins to pull it to the right (in the Northern Hemisphere).
- The Balance: As the air continues to accelerate and turn, the Coriolis Force eventually becomes equal in strength to the PGF.
- The Result: The two forces now pull in exactly opposite directions. The air stops turning and begins to flow in a straight line parallel to the isobars.
2. Why “Parallel” is Important
On a standard surface weather map, you expect wind to blow across the lines from High to Low. However, on an upper-level chart, you will see that the wind flows along the lines.
- Rule of Thumb (Buys Ballot’s Law): In the Northern Hemisphere, if you stand with your back to the geostrophic wind, low pressure will always be on your left.
3. Mathematical Approximation
In meteorology, the geostrophic wind speed ($V_g$) can be calculated using the pressure gradient and the Coriolis parameter:
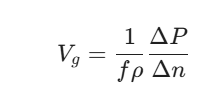
Where:
- f is the Coriolis parameter (2ωsinφ).
- ρ is air density.
- ΔP / Δn is the pressure gradient.
This formula tells us that if the isobars are closer together (a steeper gradient), the geostrophic wind must blow faster to create enough Coriolis force to maintain the balance.
4. Geostrophic vs. Surface Winds
The main reason we distinguish “geostrophic” winds is because they don’t experience friction.
| Feature | Geostrophic Wind (Upper Air) | Surface Wind |
| Forces Involved | PGF + Coriolis | PGF + Coriolis + Friction |
| Direction | Parallel to isobars | Crosses isobars (toward Low) |
| Speed | Generally faster | Slower due to drag |
Why It Matters
The geostrophic wind is a very close approximation of how the Jet Stream behaves. By calculating the geostrophic wind, meteorologists can predict where large weather systems will be steered across the globe, even if they don’t have a weather station at every single point in the upper atmosphere.
Is there a way to look at the geostrophic wind mathematically?
Yes, the geostrophic wind is one of the most fundamental mathematical approximations in meteorology. It is derived by assuming a perfect force balance between the Pressure Gradient Force (PGF) and the Coriolis Force.
Here is the step-by-step mathematical breakdown.
1. The Force Balance Equation
To find the geostrophic wind, we start with the horizontal equations of motion and set the acceleration to zero (equilibrium). We also assume there is no friction.
The balance for the x and y horizontal components is:
- Coriolis Force = Pressure Gradient Force
Mathematically, for the u (east-west) and v (north-south) wind components:
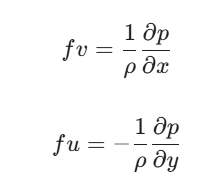
Where:
- f is the Coriolis parameter (2ω sin φ).
- ρ is the air density.
- p is the atmospheric pressure.
- x, y are the horizontal distances.
2. Solving for Geostrophic Wind Speed (Vg)
By rearranging those equations, we can define the components of the geostrophic wind:
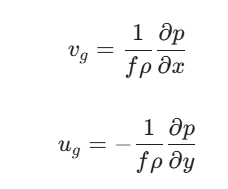
The total magnitude (speed) of the geostrophic wind (Vg) is:
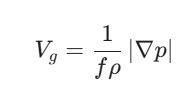
3. What the Math Tells Us
Looking at these variables reveals several “laws” of the atmosphere:
- Inversely Proportional to Latitude (f): Since f = 2ωsinφ, as you get closer to the equator (φ = 0), the denominator becomes very small. This means that for the same pressure gradient, the geostrophic wind speed would theoretically become infinite at the equator. This is why the geostrophic approximation fails at the tropics.
- Proportional to the Gradient (∂p): The larger the pressure difference over a set distance, the faster the wind.
- Inversely Proportional to Density (ρ): At higher altitudes where the air is thinner (lower density), the same pressure gradient will produce a much faster wind than it would at sea level.
4. Pressure vs. Height Coordinates
Meteorologists often work with “constant pressure surfaces” (upper-level charts) rather than “constant altitude.” On these maps, we measure the change in geopotential height (Z) rather than pressure. The math simplifies to:
(Where g is the acceleration due to gravity.)
This version is even more popular because density (ρ) drops out of the equation, making it much easier to calculate wind speeds directly from the contour lines on a weather map.
Summary Table: Variable Impact on Vg
| Increase in… | Effect on Geostrophic Wind Speed |
| Pressure Gradient | Increases speed |
| Latitude (moving toward Poles) | Decreases speed (for same gradient) |
| Altitude (Lower Density) | Increases speed |
| Friction | N/A (Geostrophic wind assumes zero friction) |
What are gradient winds?
While the geostrophic wind assumes air moves in a straight line, the gradient wind accounts for air moving along curved paths.
In nature, isobars are rarely perfectly straight; they curve around high-pressure “ridges” and low-pressure “troughs.” When air curves, a third force enters the mathematical balance: Centrifugal Force.
1. The Three-Way Balance
The gradient wind is the result of a balance between three forces:
- Pressure Gradient Force (PGF): Pulls air toward the Low.
- Coriolis Force: Pulls air to the right (in the Northern Hemisphere).
- Centrifugal Force: Pulls the air outward from the center of the curve (just like you feel pushed to the side when a car turns quickly).
2. Cyclonic vs. Anticyclonic Flow
Because the centrifugal force always points outward from the center of the curve, it helps the PGF in some cases and opposes it in others. This leads to two different wind behaviors:
A. Around a Low (Cyclonic Flow)
Around a Low, the PGF pulls inward, while the Coriolis and Centrifugal forces pull outward.
- To maintain balance, the Coriolis force doesn’t have to work as hard.
- Result: The gradient wind is slower than the theoretical geostrophic wind. This is called subgeostrophic flow.
B. Around a High (Anticyclonic Flow)
Around a High, the PGF pulls outward, and the Centrifugal force also pulls outward. The Coriolis force must pull inward to balance both of them.
- To create enough Coriolis force to balance the other two, the wind must blow faster.
- Result: The gradient wind is faster than the theoretical geostrophic wind. This is called supergeostrophic flow.
3. The Gradient Wind Equation
Mathematically, we add a curvature term to the geostrophic balance. If V is the wind speed and R is the radius of the curve:
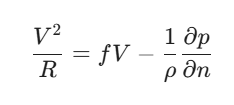
Where:
- V2 / R is the Centrifugal Acceleration.
- fV is the Coriolis Force.
- (1 / φ) * (∂p / ∂n) is the Pressure Gradient Force.
4. Why It Matters: The “Speed Limit” of Highs
The math behind gradient winds explains a very interesting weather phenomenon:
- Lows can be infinitely strong: Since the PGF and Centrifugal forces oppose each other in a Low, you can have incredibly tight pressure gradients (like in a hurricane) and still have a physical balance.
- Highs have a speed limit: In a High, the Centrifugal force and PGF both point outward. If the pressure gradient becomes too steep, the Coriolis force won’t be strong enough to keep the air in a curve, and the “High” will essentially fling its air away and weaken. This is why we have “Super-Storm” Lows but never “Super-Storm” Highs.
Summary Comparison
| Feature | Geostrophic Wind | Gradient Wind |
| Path | Straight | Curved |
| Forces | PGF + Coriolis | PGF + Coriolis + Centrifugal |
| In a Low | Theoretical Speed | Slower (Subgeostrophic) |
| In a High | Theoretical Speed | Faster (Supergeostrophic) |
How do clouds describe wind and pressure patterns aloft?
Clouds act as the atmosphere’s “visual tracers.” Because clouds are moved by winds and formed by pressure changes, their shape, height, and movement provide a direct map of the invisible forces acting thousands of feet above our heads.
Here is how you can read the sky to understand the patterns aloft.
1. Cloud Movement: The Wind Vane Aloft
By watching the direction clouds are moving, you are observing the Geostrophic or Gradient wind in action.
- Speed: Fast-moving, “shredded” clouds (like uncinus or mare’s tails) indicate high wind speeds and a steep pressure gradient aloft.
- Directional Shear: If you see low-level clouds moving in one direction (e.g., from the South) and higher clouds moving in another (e.g., from the West), you are witnessing wind shear.
- This often indicates advection: Warm air being pushed over cold air (warm advection), which usually precedes a change in pressure and incoming rain.
2. Cloud Shapes: Troughs and Ridges
The large-scale “wiggles” in the jet stream (troughs and ridges) create specific cloud signatures.
Troughs (Low Pressure Aloft)
In a trough, air is being stretched and forced to rise (divergence).
- What you see: Extensive, thick cloud cover and organized bands of precipitation.
- The Pattern: As a trough approaches, you will see clouds thickening from high cirrus to mid-level altostratus.
Ridges (High Pressure Aloft)
In a ridge, air is sinking and compressing (convergence).
- What you see: Clear, blue skies or very thin, wispy clouds. Sinking air evaporates moisture, so ridges act as “cloud killers.”
3. Specific Cloud Indicators
Altocumulus Lenticularis (The “UFO” Cloud)
These lens-shaped clouds form when high-speed winds are forced over mountains.
- What they tell us: They indicate stable air but very high wind speeds aloft. They mark the crests of “mountain waves” in the atmosphere, signaling high-altitude turbulence.
Cirrus “Mare’s Tails”
The hooked ends of these wispy clouds are caused by winds at higher altitudes blowing faster than winds at lower altitudes.
- What they tell us: They signal the presence of a Jet Stream nearby and often indicate that a surface low-pressure system (and its associated fronts) is about 24 to 48 hours away.
4. Vertical Development: Convection and Pressure
The height of a cloud tells you about the vertical pressure gradient and stability.
- Towering Cumulus: When you see clouds growing vertically into “castles,” it means the pressure is dropping rapidly with height, and the air is unstable. The upward Pressure Gradient Force is winning over gravity.
- Flat Top (Anvil): When a thunderstorm hits the Tropopause, it flattens out. This describes the boundary where the pressure and temperature patterns change, preventing the air from rising further.
Summary: Reading the Sky
| Cloud Observation | Wind/Pressure Interpretation |
| Clouds moving South to North | Low pressure is to the West (Buys Ballot’s Law). |
| Lenticular (Lens) Clouds | Strong winds aloft hitting a mountain barrier. |
| Rapidly thickening clouds | Falling pressure; an upper-level trough is arriving. |
| V-shaped “clearing” line | Passage of a cold front and a shift to high pressure. |
How do upper-level charts describe the winds?
Upper-level charts describe winds by mapping geopotential height rather than pressure. On these maps, we aren’t looking at how pressure changes at a fixed height; instead, we look at how the height of a specific pressure surface (like the 500 mb level) wobbles up and down.
Because these charts represent the atmosphere above the reach of ground friction, the winds they describe are almost perfectly geostrophic.
1. Height Contours and Wind Speed
On an upper-level chart, you see lines called isohypses (lines of equal height). These function exactly like isobars on a surface map.
- The Gradient: The closer these height contours are to one another, the steeper the “slope” of the pressure surface.
- Wind Speed: A steeper slope creates a stronger Pressure Gradient Force. Therefore, closely packed height contours indicate high wind speeds (the Jet Stream).
- The Rule: Wind speed is directly proportional to the “tightness” of these height lines.
2. Ridges, Troughs, and Wind Direction
Upper-level charts reveal the “wavy” nature of the atmosphere. The direction of the wind is determined by the shape of these waves:
- Troughs (Dips): These are elongated areas of low height. In the Northern Hemisphere, winds flow counter-clockwise around a trough. As air enters a trough, it typically slows down; as it exits, it accelerates.
- Ridges (Humps): These are elongated areas of high height. Winds flow clockwise around a ridge.
- Flow Pattern: Because there is no friction, the wind blows parallel to the height contours. If the lines run West to East, the wind is a “zonal” flow. If they wiggle North to South, it is a “meridional” flow.
3. The “Steering” Principle
Upper-level charts are often called “steering charts.” Surface weather systems (like cyclones and anticyclones) are essentially small eddies pushed along by the much larger, faster winds described on these maps.
- 500 mb Level: This is the “middle” of the atmosphere (approx. 18,000 ft). The winds here generally dictate the direction a storm will move over the next 24–48 hours.
- 250/300 mb Level: This is where the Jet Stream lives. These charts show the “core” of the highest winds, which act as the boundary between cold polar air and warm tropical air.
4. Divergence and Convergence
Upper-level charts allow meteorologists to see where air is “piling up” or “spreading out,” which is the secret to predicting surface pressure changes:
| Upper-Level Feature | Atmospheric Action | Effect on Surface Pressure |
| Divergence (Air spreads out) | Pulls air up from below | Low Pressure forms at the surface |
| Convergence (Air piles up) | Pushes air down | High Pressure forms at the surface |
Summary Table: Reading the Upper-Level Wind
| Observation on Chart | Wind Interpretation |
| Contours are tight | High wind speeds (Jet Streak). |
| Contours are wide | Light, calm winds aloft. |
| Contours dip South (NH) | A trough; likely cold air and stormy weather. |
| Contours bulge North (NH) | A ridge; likely warm air and clear weather. |
How do upper-level winds in the Southern Hemisphere behave?
Upper-level winds in the Southern Hemisphere follow the same fundamental physics as those in the Northern Hemisphere, but with one major “reversal”: the Coriolis force deflects air to the left instead of the right.
This single change flips the direction of rotation for every weather system across half the globe.
1. The Direction of Rotation
Because the Coriolis force pulls moving air to the left, the balance between the Pressure Gradient Force (PGF) and Coriolis creates a different “spin” around pressure centers aloft.
- Lows (Cyclones) Aloft: In the Southern Hemisphere, air spirals clockwise into a low-pressure center.
- Highs (Anticyclones) Aloft: Air spirals counter-clockwise out of a high-pressure center.
2. Geostrophic Balance in the South
Just like in the North, upper-level winds eventually reach geostrophic balance, where the PGF and Coriolis force cancel each other out. This causes the wind to blow parallel to the height contours (isohypses).
- The Rule (Buys Ballot’s Law): If you stand with your back to the upper-level wind in the Southern Hemisphere, low pressure will be on your right. (This is the exact opposite of the Northern Hemisphere, where it would be on your left).
3. The Southern Jet Streams
The Southern Hemisphere also has a Polar Jet and a Subtropical Jet. However, they have distinct characteristics compared to the Northern Hemisphere:
- Stronger and Faster: The Southern Hemisphere has much less landmass and much more open ocean. Land creates friction and “mountain waves” that slow down and disrupt the jet stream. Because the Southern Hemisphere is mostly water, the upper-level winds are often faster and more consistent (the “Roaring Forties” and “Screaming Sixties”).
- West to East Flow: Despite the flip in rotation around storms, the overall flow of the Jet Stream is still West to East (Westerly).
- Why? Because even in the South, the temperature gradient goes from warm (Equator) to cold (Pole). This thermal gradient, combined with the leftward Coriolis deflection, results in a net movement toward the East.
4. Summary Comparison
| Feature | Northern Hemisphere | Southern Hemisphere |
| Coriolis Deflection | To the Right | To the Left |
| Low Pressure (Aloft) | Counter-Clockwise | Clockwise |
| High Pressure (Aloft) | Clockwise | Counter-Clockwise |
| Jet Stream Direction | West to East | West to East |
| Buys Ballot’s Law | Low is on the Left | Low is on the Right |
5. Why Pilots Care
When flying international routes across the equator, pilots must switch their mental maps. If they are flying toward a Low and forget they are in the Southern Hemisphere, their drift corrections will be completely backward, and their altimeter errors will behave differently.
How does friction change the behaviour of surface winds?
While upper-level winds glide smoothly over the atmosphere, surface winds have to navigate a “rough” Earth. Friction—the resistance caused by trees, buildings, mountains, and even the ocean’s surface—fundamentally changes the balance of forces, altering both wind speed and direction.+1
Here is how friction breaks the geostrophic balance.
1. The “Braking” Effect (Wind Speed)
The most immediate effect of friction is to slow the wind down. This resistance occurs in the Atmospheric Boundary Layer, which typically extends from the ground up to about 2,000–3,000 feet (1 km).
- Land vs. Water: Friction is much stronger over land (due to “rough” obstacles) than over the relatively smooth ocean. This is why coastal areas are often much windier than inland areas.
- Vertical Profile: As you move higher up, the effect of friction decreases. This creates wind shear, where wind speed increases the higher you go until it reaches its “free” geostrophic speed.
2. Breaking the Balance (Wind Direction)
Friction doesn’t just slow the wind; it changes its direction by disrupting the “tug-of-war” between the Pressure Gradient Force (PGF) and the Coriolis Force.
- Slower Speed = Weaker Coriolis: The Coriolis force is dependent on wind speed. When friction slows the wind, the Coriolis force weakens.
- PGF Wins: The Pressure Gradient Force (which doesn’t care about speed) remains just as strong. It now “outpulls” the weakened Coriolis force.
- The Result: Instead of blowing parallel to the isobars (like geostrophic winds), the wind is pulled across the isobars toward the area of lower pressure.
3. Spirals: Inflow and Outflow
Because friction forces the wind to cross isobars, air no longer circles perfectly around pressure centers. It develops a “spiral” pattern:
- In Low Pressure (Cyclones): Air spirals inward and converges at the center. This forced “pile-up” of air at the center is what causes air to rise, leading to clouds and rain.
- In High Pressure (Anticyclones): Air spirals outward (diverges) from the center. To replace this air, air must sink from above, which leads to clear skies.
4. The Angle of Cross
The “rougher” the surface, the more the wind will turn inward toward the low pressure.
| Surface Type | Friction Level | Crossing Angle |
| Ocean/Smooth Water | Low | 10° – 20° |
| Flat Land/Plains | Moderate | 20° – 30° |
| Forests/Cities/Mountains | High | 30° – 45° |
Summary: Friction’s Impact
- Speed: Always decreases wind speed compared to the upper atmosphere.
- Direction: Causes wind to blow across isobars toward lower pressure.
- Weather Impact: Creates the convergence (at Lows) and divergence (at Highs) necessary for weather to form. Without friction, air would just circle a storm forever rather than spiraling in to fill the “vacuum.”
What is the relationship between winds and vertical air motions?
The relationship between horizontal winds and vertical air motion is a matter of conservation of mass. Since air is a fluid, it cannot simply “disappear.” If air moves together horizontally (convergence), it must be pushed up or down. If it spreads apart (divergence), air must rush in from above or below to fill the void.
This 3D movement is the primary reason we have “weather” like rain and sunshine.
1. Surface Convergence and Rising Air
When horizontal winds at the surface spiral inward toward a center of low pressure (due to friction), the air molecules eventually collide. Since the ground is solid, the air has nowhere to go but up.
- The Process: This rising motion is called lifting. As the air rises into lower pressure, it expands and cools.
- The Result: Cooling leads to condensation, cloud formation, and eventually precipitation. This is why low-pressure systems are almost always associated with “bad” weather.
2. Surface Divergence and Sinking Air
Conversely, around a high-pressure system, horizontal winds spiral outward. This creates a “hole” at the center of the high.
- The Process: To fill this space, air from higher up in the atmosphere must sink downward. This is called subsidence.
- The Result: Sinking air is compressed by the higher pressure near the ground, which causes it to warm up. Warming air can “hold” more water vapor, so existing clouds evaporate. This is why high pressure is associated with “fair” weather and clear skies.
3. The Upper-Level Connection
The atmosphere works like a giant vertical loop. For air to rise at a surface Low, there must be something “pulling” it from above.
- Divergence Aloft: High in the atmosphere (near the Jet Stream), air often spreads apart. This creates a vacuum effect that “sucks” the surface air upward, strengthening the surface Low.
- Convergence Aloft: When winds pile up in the upper atmosphere, they push air downward, strengthening the surface High.
4. Summary Table: Horizontal vs. Vertical
| Feature | Surface Wind Action | Vertical Motion | Resulting Weather |
| Low Pressure | Convergence (Inward) | Rising (Ascent) | Clouds, Rain, Storms |
| High Pressure | Divergence (Outward) | Sinking (Subsidence) | Sunny, Dry, Clear |
5. Hydrostatic Balance (The Exception)
Why doesn’t the vertical pressure gradient (which is much stronger than the horizontal one) just blow the atmosphere into space?
The atmosphere exists in a state of Hydrostatic Balance, where the upward Pressure Gradient Force is almost perfectly balanced by the downward pull of Gravity.
- When it breaks: In extreme cases, like a severe thunderstorm or a tornado, the upward force significantly overpowers gravity, leading to violent vertical updrafts that can exceed 100 mph.
What are the hydrostatic and hypsometric equations and how can they be derived?
To understand the structure of the atmosphere, we use two fundamental equations: the Hydrostatic Equation, which explains why the atmosphere doesn’t collapse or fly away, and the Hypsometric Equation, which tells us how the thickness of an air layer changes with temperature.
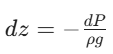
1. The Hydrostatic Equation
This equation describes the vertical balance of forces. It assumes that the upward-directed pressure gradient force is exactly balanced by the downward pull of gravity.
The Derivation
Imagine a thin “parcel” or cylinder of air with a cross-sectional area (A), a height (dz), and a density (ρ).
Weight of the parcel: The downward force is the mass of the air multiplied by gravity (g). Since Mass = Density * Volume, and $Volume = A * dz: Fgravity = ρ • A • dz • g
Pressure Force: The pressure at the bottom (P) is slightly higher than the pressure at the top (P + dP). The net upward force is the difference in pressure multiplied by the area: Fpressure = -dP • A (The negative sign indicates pressure decreases as height increases).
Balance: In a stable atmosphere, Fpressure = Fgravity: -dP • A = ρ • A • dz • g
Final Form: Cancel out the Area (A) and rearrange: dP / dz = -ρg
2. The Hypsometric Equation
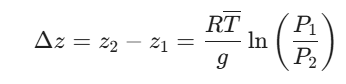
While the hydrostatic equation deals with a single point, the Hypsometric Equation allows us to calculate the thickness (Δz) between two different pressure levels (like 1000 mb and 500 mb).
The Derivation
We derive this by combining the Hydrostatic Equation with the Ideal Gas Law.
Start with Hydrostatic:
Substitute the Ideal Gas Law: From P = ρRT, we know that ρ = P / (RT). Plugging this in:
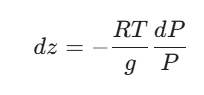
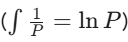
Integrate: To find the total height difference between pressure level P1 (bottom) and P2 (top):
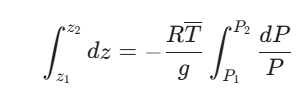
(Note: We use T bar, the mean temperature of the layer, because temperature changes as you go up).
Final Form: Solving the integral
3. Why These Equations Matter
A. Temperature and “Thickness”
The Hypsometric Equation proves that warm air is less dense and takes up more space. * If T bar is high, the thickness (Δz) between two pressure levels is large.
- If T bar is low, the thickness is small.
- Forecasting Tip: Meteorologists look at “500-1000 mb thickness” maps. If the thickness is low, it’s a sign of a cold air mass (and potential snow).
B. Determining Altitude
This is how your phone or a plane’s altimeter works. By measuring the current pressure (P2) and knowing the sea-level pressure (P1), the device uses the Hypsometric Equation to solve for your height (z).
C. Constructing Upper-Level Charts
Since we can’t easily measure the height of the 500 mb level everywhere with a ruler, we use the Hypsometric Equation to calculate its height based on the temperature of the air below it.
Summary Table
| Equation | Focus | Key Relationship |
| Hydrostatic | Vertical Stability | Pressure decreases as altitude increases. |
| Hypsometric | Layer Thickness | Warm layers are thick; cold layers are thin. |
Solved Problems
Here is a collection of high-level application and mathematical problems based on the principles of atmospheric dynamics, thermodynamics, and the equations of motion we have discussed.
1. The Ideal Gas Law & Density
Problem: A weather balloon at the surface ($1013 \, \text{hPa}$) measures a temperature of $20^{\circ}\text{C}$. It rises to a level where the pressure is $500 \, \text{hPa}$ and the temperature is $-20^{\circ}\text{C}$. Calculate the ratio of the air density at the surface to the density at the $500 \, \text{hPa}$ level.
Solution:
Using $P = \rho RT$, we find $\rho = P / RT$.
Convert temperatures to Kelvin: $T_1 = 293.15 \, \text{K}$, $T_2 = 253.15 \, \text{K}$.
$\rho_1 / \rho_2 = (P_1 / RT_1) / (P_2 / RT_2) = (P_1 \cdot T_2) / (P_2 \cdot T_1)$.
$\rho_1 / \rho_2 = (1013 \cdot 253.15) / (500 \cdot 293.15) \approx \mathbf{1.75}$.
The air at the surface is $1.75$ times denser than at the $500 \, \text{hPa}$ level.
2. Hydrostatic Balance Calculation
Problem: If the pressure at sea level is $1013 \, \text{hPa}$ and the air density is constant at $1.2 \, \text{kg/m}^3$, at what altitude would the pressure drop to $1000 \, \text{hPa}$? (Assume $g = 9.8 \, \text{m/s}^2$).
Solution:
Use the Hydrostatic Equation: $\Delta P = -\rho g \Delta z$.
$\Delta P = 1000 – 1013 = -13 \, \text{hPa} = -1300 \, \text{Pa}$.
$-1300 = -(1.2)(9.8)(\Delta z)$.
$\Delta z = 1300 / 11.76 \approx \mathbf{110.5 \, \text{meters}}$.
3. Hypsometric Equation (Thickness)
Problem: Calculate the thickness of the $1000$ to $500 \, \text{hPa}$ layer if the average temperature of the layer is $0^{\circ}\text{C}$ ($273.15 \, \text{K}$).
Solution:
$\Delta z = \frac{RT}{g} \ln(P_1 / P_2)$.
$\Delta z = 287 • 273.15 / 9.8 ln(1000 / 500. Δz = 8000 • 0.693 ≈ 5544 meters.
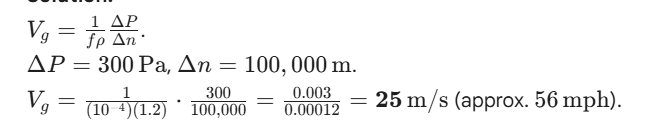
4. Geostrophic Wind Speed
Problem: At a latitude of 45° N, the pressure gradient is 3 hPa per 100 km. If air density is 1.2 kg/m3, what is the geostrophic wind speed? (f ≈ 10-4 s-1 at 45°).
Solution:
5. Coriolis Force on a Moving Plane
Problem: A plane flies at 250 m/s at the North Pole (f = 1.45 * 10-4 s-1). What is the Coriolis acceleration acting on the plane?
Solution:
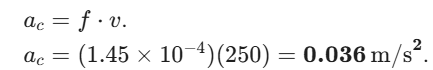
While small, this force must be constantly corrected by the autopilot to maintain a straight track over the ground.
6. Altimeter Error (Flying High to Low)
Problem: A pilot flies from a region of 1013 hPa to 993 hPa without updating the altimeter. If 1 hPa ≈ 30 ft, what is the altitude error?
Solution:
The pressure dropped by 20 hPa.
Since the altimeter “sees” lower pressure, it thinks the plane is higher.
Error = 20 hPa * 30 ft/hPa = 600 feet.
The plane is actually 600 feet lower than the altimeter indicates.
7. Gradient Wind (Subgeostrophic)
Problem: Why is wind speed around a Low-pressure system typically lower than the geostrophic value?
Solution:
In cyclonic flow, the Centrifugal force acts in the same direction as the Coriolis force (outward). Both must balance the inward Pressure Gradient Force. Because the Centrifugal force “helps” the Coriolis force, the wind doesn’t need to blow as fast to achieve balance. This is subgeostrophic flow.
8. Surface Wind Angle
Problem: If a surface wind is blowing at an angle of 30° across the isobars toward a Low, and the geostrophic wind aloft is 20 m/s, what is the likely cause of the 30° deviation?
Solution:
Surface Friction. Friction slows the wind, weakening the Coriolis force, which allows the Pressure Gradient Force to pull the air across the isobars toward the lower pressure.
9. Thermal Wind Relationship
Problem: If the temperature increases toward the North in the Northern Hemisphere, how does the geostrophic wind change with height?
Solution:
Using the thermal wind relation, if warm air is to the North, the westerly wind component will decrease with height (or the easterly component will increase). This is the opposite of the standard “warm South/cold North” setup that creates the Jet Stream.
10. Sea Breeze Circulation
Problem: On a hot afternoon, the land temperature is 35°C and the ocean is 20°C. Describe the pressure and wind result.
Solution:
The air over land expands (lower density/pressure), while the air over the water remains dense (higher pressure). The PGF drives air from the water to the land, creating a Sea Breeze.
11. Buys Ballot’s Law Application
Problem: You are in the Southern Hemisphere and the wind is hitting you in the face. Where is the Low pressure?
Solution:
According to Buys Ballot’s Law for the Southern Hemisphere: stand with your back to the wind, and Low is on your right. Since the wind is hitting your face, turn around. Now the Low is on your left.
12. Potential Temperature (θ)
Problem: Why do meteorologists use Potential Temperature instead of actual temperature when comparing air at different altitudes?
Solution:
Actual temperature drops as air rises due to expansion (Adiabatic cooling). Potential temperature is the temperature air would have if brought down to 1000 hPa. It allows us to see if an air mass is truly warmer or colder regardless of its current height.
13. Centrifugal Force in a Tornado
Problem: A tornado has a radius of 100 m and wind speeds of 70 m/s. Calculate the centrifugal acceleration.
Solution:
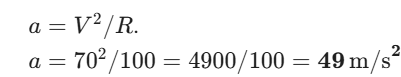
This is 5 times the acceleration of gravity, explaining why debris is violently flung outward.
14. Convergence and Vertical Velocity
Problem: If 100 units of air enter a region horizontally but only 80 units leave, what happens to the remaining 20 units?
Solution:
Due to the Continuity Equation (Conservation of Mass), the 20 units must move vertically. In this case (convergence), the air is forced upward.
15. The “Speed Limit” of High Pressure
Problem: Mathematically, why can’t we have a “Category 5” High-pressure system?
Solution:
In a High, PGF and Centrifugal force both point outward. The Coriolis force (fV) must balance both. As the pressure gradient (PGF) increases, V must increase. Eventually, the V2/R term grows faster than the fV term. Mathematically, the square root in the gradient wind equation becomes imaginary, meaning the balance breaks and the air is flung out of the High.