
Earth and Atmospheric Sciences
In 2026, the patterns of international business are defined by a shift from pure efficiency to resilience and geostrategy. While the era of hyper-globalization has evolved, the world is not necessarily “deglobalizing”—it is “reglobalizing” into new, complex corridors.
Here is a breakdown of the current global patterns across trade, geography, and technology.
1. Geopolitical Realignment (The “New Corridors”)
The most significant pattern today is the fracturing of traditional trade routes. National security and political alliances now often outweigh cost-savings in sourcing decisions.
- US-China Fracturing: The rivalry remains the central axis. Trade flows are being redirected away from direct US-China exchange toward third-party “bridge” nations.1
- Friend-Shoring & Near-Shoring: Companies are relocating production to countries with shared values or geographic proximity. For example:
- Mexico and Canada have strengthened their roles as primary hubs for the US market.
- Vietnam, India, and Poland have emerged as major alternative manufacturing bases for Western firms.2
- Intra-Regional Growth: Regional blocs like ASEAN and the African Continental Free Trade Area (AfCFTA) are seeing increased internal trade as they attempt to reduce dependence on external shocks.
2. Sectoral Patterns: Goods vs. Services
There is a clear divergence in how different types of business are moving across borders.
| Sector | 2026 Growth Pattern | Key Drivers |
| Merchandise (Goods) | Slowing/Stagnant | Higher tariffs, rising logistics costs, and a pivot to domestic production for critical goods (semiconductors, EV batteries). |
| Commercial Services | Resilient/Rising | Growth in digital consulting, remote professional services, and licensing of software and intellectual property. |
| Digital Trade | Explosive | Cross-border data flows and “digitally deliverable” services now account for a massive share of global value. |
3. The “AI-Industrial” Infrastructure Pattern3
International business is currently being reshaped by the physical requirements of Artificial Intelligence.4
- Commodity Demand: The build-out of AI data centers globally has created a surge in the trade of copper, aluminum, and advanced cooling systems.5
- Supply Chain Automation: AI is being integrated into “smart logistics,” where predictive algorithms manage port congestion and independent agents (Agentic AI) make real-time procurement decisions to bypass trade barriers.6
- Uneven Adoption: The US and China lead in AI infrastructure investment, but regions like the Middle East (notably Saudi Arabia and the UAE) are using sovereign wealth to position themselves as global digital hubs.
4. Sustainability and “Green” Protectionism
Environmental regulations are no longer just CSR initiatives; they are now hard trade barriers.
- Carbon Border Adjustments: Policies like the EU’s Carbon Border Adjustment Mechanism (CBAM) mean that the “carbon footprint” of a product is now a primary factor in its international cost.
- Circular Economy: Supply chains are shifting toward “circularity,” where businesses focus on the cross-border return and recycling of materials rather than a linear “extract-make-dispose” model.
5. Summary of Major Players
- The United States: Transitioning toward “America First” industrial policies, emphasizing domestic manufacturing and high-tech protectionism.
- China: Facing slowing domestic demand, China is aggressively expanding its e-commerce and infrastructure footprints in Global South markets (Africa, SE Asia, and Latin America).
- India: Standing out as a high-growth “bright spot,” benefiting from both strong domestic demand and its role as a key alternative in the “China Plus One” strategy.7
How are commodity flows modeled?
Modeling commodity flows is a multi-dimensional process that combines classical economic theory with modern computational power.1 In 2026, these models have evolved to handle not just supply and demand, but also geostrategic risks and real-time environmental data.
Commodity flows are typically modeled using four primary frameworks:
1. The Gravity Model (The “Workhorse”)2
Originally inspired by Newton’s Law of Gravitation, this is the most common empirical model for trade.3 It posits that the flow of a commodity between two countries is determined by:
- Economic Mass: Larger economies (higher GDP) or larger producers/consumers of a specific resource attract more trade.4
- Distance (Friction): Physical distance, transport costs, and “cultural distance” (different languages or legal systems) act as resistance.5
- Modern Twist: In 2026, “geopolitical distance” (alliances vs. rivalries) is often added as a friction variable, reflecting the “friend-shoring” patterns of the current decade.
Flowij = G * (Miα * Mjβ) / Dijγ
(Where M is mass, D is distance, and G is a constant.)
2. Computable General Equilibrium (CGE) Models
CGE models are large-scale simulations that treat the entire world economy as a system of interlinked equations.
- Interdependence: They model how a shock in one sector (e.g., a drought affecting Brazilian soy) ripples through other markets (e.g., livestock prices in China and shipping demand in the Atlantic).
- Policy Analysis: Governments use these to predict the impact of new “Green” taxes or trade tariffs.
- GTAP: The Global Trade Analysis Project (GTAP) is the industry-standard database and model used by organizations like the World Bank to run these simulations.
3. Network Analysis (Graph Theory)
Rather than looking at just two partners, this model treats global trade as a complex web or “graph.”
- Nodes and Edges: Countries are “nodes” and trade flows are “edges.”
- Centrality: Models identify “hub” countries (like Singapore for oil or Chile for copper) that are critical to the entire system’s stability.
- Vulnerability Mapping: By modeling the network, businesses can identify “single points of failure”—bottlenecks where a strike, a canal blockage, or a conflict could collapse a global supply chain.
4. Predictive AI & Satellite Integration
In 2026, traditional models are increasingly being augmented by Agentic AI and real-time “Alternative Data.”
- Satellite Imagery: Models now ingest real-time data on the number of tankers anchored off ports or the “greenness” of crops to predict harvest yields before they are officially reported.10
- Predictive Intelligence: Machine learning models identify non-linear patterns (e.g., how specific weather patterns in the Pacific correlate with energy demand in Europe) to forecast flows months in advance.11
- Digital Twins: Companies create “digital twins” of their global commodity flows to run “What If” scenarios involving port strikes, carbon tax hikes, or regional conflicts.
Summary Table of Modeling Approaches
| Model Type | Best Used For… | Key Input Data |
| Gravity | Long-term trade patterns | GDP, Distance, Trade Agreements |
| CGE | Policy changes & shocks | Input-Output tables, Tax rates |
| Network | Risk & Resilience | Trade routes, Hub centrality |
| AI/Digital Twin | Real-time tactical decisions | Satellites, Sensor data, News sentiment |
What is the competitive advantage of a nation?
In 2026, the competitive advantage of a nation is no longer just about what it has (natural resources), but about how it innovates and the strength of its ecosystems.
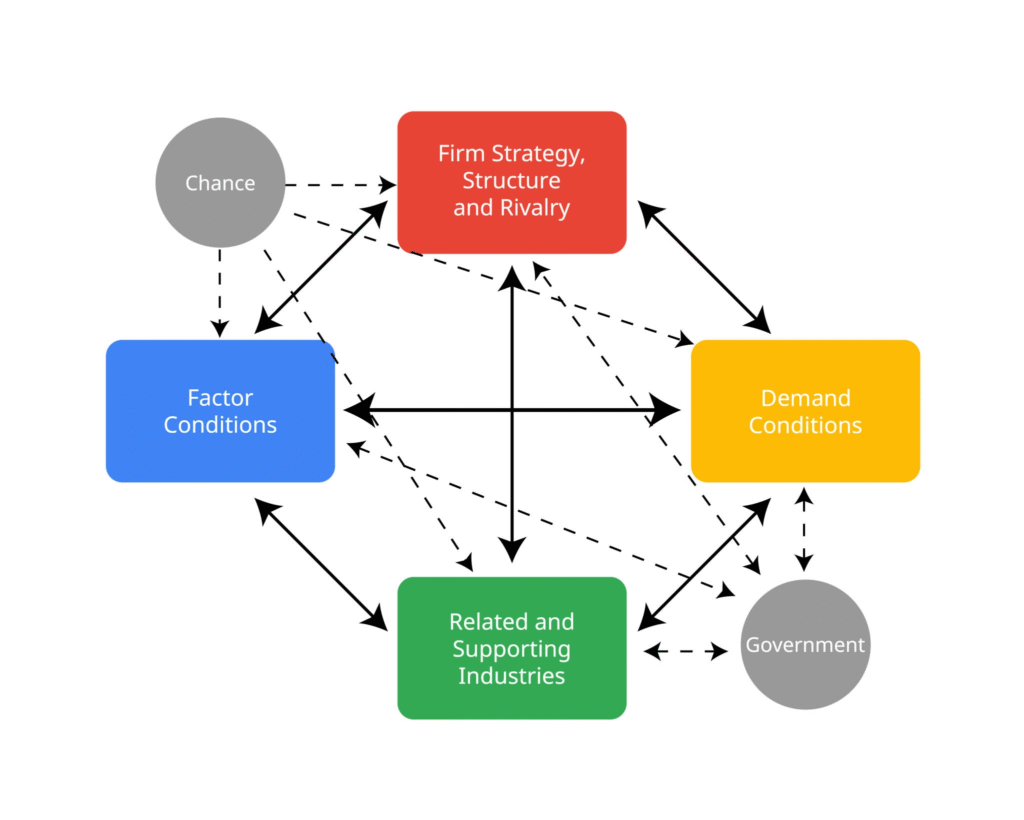
While traditional “Comparative Advantage” (Adam Smith and David Ricardo) focused on low costs and labor, the modern standard is Michael Porter’s Diamond Model. This theory argues that a nation’s success in a specific industry depends on four primary determinants that form a reinforcing “diamond.”1
1. The Porter’s Diamond Model2
According to Porter, nations succeed in industries where the “home environment” is the most forward-thinking and dynamic.3
Getty Images
- Factor Conditions: This goes beyond raw materials.4 It distinguishes between Basic Factors (land, climate, unskilled labor) and Advanced Factors (digital infrastructure, specialized highly-skilled labor, university research).5 In 2026, a nation’s “AI readiness” and “green energy grid” are its most critical advanced factors.
- Demand Conditions: A nation gains an edge if its domestic customers are sophisticated and demanding.6 If local buyers pressure companies to innovate (e.g., Japanese consumers demanding fuel efficiency or US consumers demanding seamless software), those companies become world-class.7
- Related and Supporting Industries: Success in one industry often breeds success in another. This is the concept of Clusters (e.g., Silicon Valley for tech or Northern Italy for high-end fashion). Having world-class local suppliers nearby speeds up innovation.8
- Firm Strategy, Structure, and Rivalry: Intense local competition is a good thing.9 When domestic companies (like BMW, Mercedes, and Audi in Germany) fight for market share, they are “stress-tested,” making them much stronger when they enter the global stage.10
2. The Role of Government and Chance
Porter adds two “influencing” factors that sit outside the diamond:11
- Government: In 2026, this is increasingly important through “Industrial Policy”—directing subsidies toward semiconductors or battery tech to “create” an advantage where one didn’t exist.
- Chance: Unpredictable events (wars, pandemics, or breakthrough inventions) can reset the board, destroying old advantages or creating new ones overnight.12
3. Comparison: Classical vs. Modern Advantage
| Feature | Classical (Comparative) | Modern (Competitive) |
| Source | Natural endowments (Oil, Wheat) | Innovation & Productivity |
| Sustainability | Low (others can find cheaper labor) | High (hard to replicate a “cluster”) |
| Unit of Analysis | The Nation/Resource | The Industry/Cluster |
| Goal | Cost Leadership | Differentiation & Value |
Example: Why is the Netherlands a Food Power?
The Netherlands is tiny and lacks massive farmland, yet it is the world’s second-largest agricultural exporter.13
- Factor: Advanced greenhouse tech and precision robotics.
- Demand: European consumers demanding high-quality, traceable organic produce.
- Related: A world-leading biotech and logistics sector centered around the Port of Rotterdam.
Michael Porter’s Diamond Model explained
This video provides a clear breakdown of the four determinants of national advantage and uses the German automobile industry as a case study to show how the factors interact.
What are factor conditions?
In Michael Porter’s Diamond Model, Factor Conditions refer to the “inputs” or resources a nation has available to produce goods and services.1
While classical economics focused on basic things like land and cheap labor, Porter argues that in a modern, high-tech economy, what a nation creates is more important than what it inherits.2
1. Basic vs. Advanced Factors
Porter divides these conditions into two categories.3 A sustainable competitive advantage is almost always built on the “Advanced” side.4
| Type | Examples | Strategic Value |
| Basic Factors | Natural resources, climate, location, unskilled labor, debt capital. | Low. These can be bypassed by technology or accessed by any global firm. |
| Advanced Factors | Digital infrastructure, highly skilled labor (engineers/scientists), research institutes, proprietary technical know-how. | High. These are difficult for competitors to duplicate and require sustained investment. |
2. General vs. Specialized Factors
Another layer of this model looks at how specific the resources are to a particular industry.
- General Factors: Things like a well-funded highway system or a pool of college graduates. These are useful to many industries but don’t give a specific edge to one.
- Specialized Factors: Highly specific infrastructure or labor pools.5 For example, a cluster of specialized software engineers in Bangalore for IT, or the deep-water port and specialized chemical logistics in Rotterdam. These are the true “secret sauce” of national advantage.
3. The “Paradox” of Factor Disadvantage
One of Porter’s most famous insights is that lacking a factor can actually be an advantage. When a nation faces a shortage or a high cost (a “disadvantage”), it forces companies to innovate.
- Example: Japan has almost no natural energy resources. This disadvantage forced Japanese companies to become the world leaders in energy-efficient manufacturing and compact electronics.
- Example: High labor costs in Germany forced German engineering firms to lead the world in robotics and automation to stay competitive.
4. Factor Conditions in 2026
Today, the definition of a “critical factor” has shifted. Nations are currently competing to build three specific types of advanced factors:
- Compute and Energy: Having the massive electrical grids and data center capacity required to power Generative AI is now a top-tier “Advanced Factor.”
- Sovereign Data: The availability of high-quality, localized data sets to train AI models is becoming a “Knowledge Resource” that nations guard closely.
- Climate-Resilient Infrastructure: As of 2026, a nation’s ability to provide a “green” supply chain (renewable energy for factories) is a factor that attracts premium global investment.
What are demand conditions?
In Michael Porter’s Diamond Model, Demand Conditions refer to the nature of the customer base in a nation’s home market.1
While common sense might suggest that a “good” market is simply a large one, Porter argues that the quality and sophistication of local customers are far more important than the quantity.2 When local customers are demanding, knowledgeable, and picky, they act as a “pressure cooker” that forces domestic companies to innovate faster and reach higher standards than their foreign rivals.3
1. The Three Dimensions of Home Demand
To understand if a nation’s demand provides a competitive edge, we look at three specific characteristics:
A. Sophisticated and Demanding Buyers4
Nations gain an advantage when local customers are “early adopters” or experts.5 They push companies to improve quality, features, and service.6
- Example: In Japan, consumers have extremely high expectations for electronics and “zero-defect” quality.7 This forced companies like Sony and Panasonic to master miniaturization and reliability long before they exported globally.
- Example: German drivers expect high-performance engineering for the Autobahn, forcing BMW and Mercedes to lead the world in high-speed safety and engine durability.8
B. Anticipatory Buyer Needs
If a nation’s domestic needs foreshadow a global trend, that nation’s companies get a “head start.”
- Example: Because Scandinavia implemented strict environmental regulations early, their companies (like Vestas in wind energy) developed “green” technologies years before there was a global market for them.
C. Size and Pattern of Growth
While size isn’t everything, a large home market can provide economies of scale.9 However, Porter notes that early saturation of the home market is often a blessing in disguise—it forces companies to export and innovate just to survive.10
2. Why “Mean” Customers are Good for Business
In this model, the “best” customers for a nation’s economy are actually the most difficult ones.
- Feedback Loops: Proximity to demanding buyers allows for a constant flow of information. Companies can see problems and fix them in their “backyard” before they go to the world stage.
- Standard Setting: When a nation’s local standards are the toughest in the world, its products are “battle-tested.” If a product can satisfy a demanding Swiss consumer or a tech-savvy Korean teenager, it can likely succeed anywhere else.
3. Demand Conditions in 2026
In today’s landscape, the nature of “demand” has shifted toward digital and ethical requirements:
- The “Carbon-Conscious” Consumer: In regions like the EU, consumers are increasingly demanding “Net-Zero” products. This is forcing European firms to lead in circular economy logistics and carbon tracking.
- AI Sophistication: In the US and China, a massive population of “AI-native” users is demanding seamless, agentic AI integration in every app. This creates a “training ground” for tech firms that isn’t yet present in slower-adopting regions.
- Privacy-First Demand: Nations with high demand for data sovereignty and privacy (like Germany or Singapore) are producing the world’s most secure cybersecurity and fintech software.
Summary: Factor vs. Demand
| Concept | Factor Conditions | Demand Conditions |
| Focus | Supply side (Inputs) | Customer side (Outputs) |
| Key Asset | Skilled labor, Infrastructure | Picky, sophisticated buyers |
| Edge | Lower costs or higher tech | Better products and faster innovation |
What are supporting industries?
In Michael Porter’s Diamond Model, Related and Supporting Industries refer to the presence (or absence) of world-class supplier industries and related industries within a nation.1
Think of this as the “neighborhood” or ecosystem effect. No company is an island; a firm’s ability to be world-class often depends on having world-class neighbors who provide specialized inputs, technology, and information.2
1. The Two Pillars of Support
This determinant is divided into two distinct groups that reinforce the primary industry:
A. Internationally Competitive Suppliers
A nation gains an edge when its primary companies have “back-door” access to the world’s best suppliers.
- Early Access: Local suppliers give domestic firms the first look at new components or technologies before they are exported to global competitors.3
- Collaboration: Proximity allows for “joint innovation.”4 Engineers from a car company and a battery supplier can work face-to-face to solve integration problems.
- Example: The US Semiconductor industry is supported by a world-leading Electronic Design Automation (EDA) industry (software used to design chips). Because the software and the hardware firms are in the same “neighborhood,” they innovate in lockstep.
B. Related Industries
These are industries that share common technologies, customers, or distribution channels.5 They create a “knowledge spillover” effect.
- Complementary Products: Think of Hardware and Software. The success of Silicon Valley isn’t just because of computers; it’s because the software firms and hardware firms grew up together, each pushing the other to be better.
- Example: In Italy, the success of the leather footwear industry is closely linked to the success of the leather tanning industry and the leather-working machinery industry. They share technical secrets and high-quality raw materials.
2. The Concept of “Clusters”
When you have Factor Conditions, Demand, and Supporting Industries all in one place, they form a Cluster.6 Clusters are the most powerful form of competitive advantage because they are nearly impossible for other nations to copy overnight.
| Famous Cluster | Core Industry | Supporting/Related Industries |
| Silicon Valley (USA) | Tech/Software | Venture Capital, Stanford/Berkeley, specialized legal firms, chip designers. |
| Basel (Switzerland) | Pharmaceuticals | Specialized chemical labs, biotech startups, world-class medical universities. |
| Hollywood (USA) | Entertainment | Special effects houses, talent agencies, camera equipment manufacturers, sound engineers. |
| Toyota City (Japan) | Automotive | “Just-in-Time” parts suppliers, robotics manufacturers, steel mills. |
3. Why Proximity Matters in 2026
In an era of global Zoom calls, you might think “neighborhood” doesn’t matter. However, for high-level innovation, physical proximity remains king for three reasons:
- Trust and Speed: It is faster to walk across the street to solve a technical glitch than to send an email across a time zone.
- Labor Pooling: Specialized workers can move between firms in a cluster without moving their families. This keeps specialized talent within the nation.
- The “Vibe” (Knowledge Spillovers): People from different companies meet for coffee or at conferences. They talk about trends, gossip about technology, and unknowingly exchange the “tacit knowledge” that drives breakthroughs.
4. Summary: The Supporting Industry Advantage
- Lower Costs: Efficient local supply chains reduce inventory and transport costs.7
- Faster Innovation: Specialized suppliers act as “outsourced R&D” for the main firm.
- Resilience: In 2026, having local supporting industries is a major defense against global supply chain shocks.
What are firm strategy, firm structure, and firm competition?
In Michael Porter’s Diamond Model, Firm Strategy, Structure, and Rivalry is the final point of the diamond.1 It describes the conditions in a nation that govern how companies are created, organized, and managed, as well as the nature of domestic competition.2
While the other three points of the diamond provide the ingredients for success, this point describes the process of competing. Porter argues that vigorous domestic rivalry is perhaps the most important driver of a nation’s global success.3
1. Firm Strategy and Structure
Every nation has a different “style” of management and organization that works best for certain industries. This is often deeply rooted in culture and the educational system.
- Management Styles: In Germany, many successful firms are structured around highly technical, hierarchical engineering cultures, which is perfect for complex industries like precision machinery. In contrast, US firms often favor flatter, more flexible structures that excel in fast-moving sectors like software and biotech.
- Capital Markets: How a nation funds its companies matters.
- The US/UK model focuses on public stock markets and quarterly profits, which can drive rapid growth but sometimes short-term thinking.
- The German/Japanese model often involves long-term bank debt and “patient capital,” allowing firms to invest in R&D that may take a decade to pay off.
2. Firm Rivalry (The “All-Out Warfare” Effect)
This is the most counterintuitive part of the model. You might think a nation should have one giant “National Champion” to take on the world. Porter argues the opposite: A nation is more competitive when it has many local rivals fighting each other.4
- Forced Innovation: When companies compete in their own backyard, they can’t rely on trade barriers or currency fluctuations. They have to get better, faster, and cheaper just to survive.
- The “Stress Test”: If a company can survive the brutal domestic competition of the Japanese electronics market or the Italian fashion scene, the rest of the world feels “easy” by comparison.
- Resource Creation: Rivalry among firms leads them to demand better specialized factors (like better university programs) and supports the growth of a local supplier base, strengthening the other parts of the diamond.
3. Real-World Examples: Rivalry in Action
| Industry | Country | The Rivalry Pattern |
| Automobiles | Germany | The “big three” (BMW, Mercedes, Audi) fight for every inch of technology and luxury, making them the global standard-bearers. |
| Consumer Electronics | Japan | At one point, Japan had over a dozen world-class electronics firms (Sony, Panasonic, Toshiba, Sharp, etc.) competing fiercely. |
| Fashion | Italy | Hundreds of small and medium-sized firms in the “Prato” textile district compete on design and quality daily. |
| Semiconductors | Taiwan | While TSMC is the giant, a massive ecosystem of “fabless” designers and testing firms (like MediaTek and ASE) compete and collaborate nearby. |
4. The 2026 Perspective: Strategic Autonomy
In today’s business landscape, firm strategy has shifted toward Resilience and Autonomy.5
- Strategic Structure: Firms are moving away from “Just-in-Time” (pure efficiency) to “Just-in-Case” structures, building redundancy into their global footprints.
- AI Integration: The new “Strategy” for 2026 is Agentic AI. Nations where firms are structured to allow AI agents to handle procurement and logistics are gaining a massive speed advantage over traditional, bureaucratic structures.
- Geopolitics as Strategy: Companies now have “Geopolitical Risk” departments. Firm strategy in 2026 is no longer just about beating a competitor—it’s about navigating the trade barriers between major power blocs.
Summary of the Diamond
When all four parts of the diamond work together, they create a Self-Reinforcing System:
- Factors give you the tools.
- Demand tells you what to build.6
- Supporting Industries give you the components.
- Rivalry forces you to build it better than anyone else.7
What are Porter’s Stages of Economic Development?
In Michael Porter’s framework, a nation’s competitive advantage isn’t static—it evolves through specific stages as the economy becomes more sophisticated.1 These stages describe how a country moves from competing on low costs to competing on innovation.
Porter originally identified four stages, but in modern application (including the 2026 economic landscape), the first three are seen as the path to prosperity, while the fourth is a potential trap.2
1. The Factor-Driven Stage3
In this initial stage, the economy’s competitive advantage is based almost entirely on basic factors of production, such as unskilled labor or natural resources.4
- Source of Advantage: Low-cost labor, fertile land, or mineral wealth.5
- Characteristics: Technology is mostly imported. Local firms act as subcontractors for foreign companies or export raw commodities.
- Vulnerability: These economies are highly sensitive to world commodity prices and exchange rate shifts.
- Example (2026): Many developing nations in Central Africa or parts of Central Asia that rely primarily on mineral exports.
2. The Investment-Driven Stage6
Success in this stage comes from the willingness and ability of the nation (and its firms) to invest massively in modern infrastructure and efficient manufacturing.
- Source of Advantage: The “Diamond” begins to form. The government plays a heavy role in coordinating large-scale infrastructure and industrial policy.
- Characteristics: Firms adopt foreign technology but improve upon it. Efficiency in production becomes the primary goal.7
- The Shift: The country moves from simply having “factors” to actively building “advanced factors” (like specialized ports or technical colleges).
- Example (2026): Vietnam and India are currently in aggressive investment-driven phases, building massive manufacturing hubs to capture supply chains moving out of China.
3. The Innovation-Driven Stage
This is the “gold standard” where all four points of the Diamond are fully active. Companies no longer just make things cheaper or better—they create entirely new things.
- Source of Advantage: R&D, proprietary technology, and world-class brand names.
- Characteristics: The economy is resilient to external shocks because its products are unique. Domestic rivalry is intense, and “clusters” of specialized industries (like Silicon Valley or the German Automotive cluster) are the primary engine of growth.8
- Global Reach: Firms at this stage don’t just export products; they export business models and intellectual property.
- Example (2026): The United States, Germany, South Korea, and Japan.
4. The Wealth-Driven Stage (The Danger Zone)
Porter describes this as a stage of decline rather than progress.9 The economy becomes driven by past success rather than future innovation.
- Characteristics: Strategic focus shifts from “investing and innovating” to “protecting and consuming.” Firms focus on mergers, acquisitions, and lobbying for government protection rather than R&D.
- Signs of Trouble: A decline in domestic rivalry, a shrinking pool of skilled labor, and a general loss of “entrepreneurial hustle.”
- The Trap: The nation remains wealthy, but its relative international competitiveness begins to slip as it fails to keep up with the “Innovation-Driven” economies.
Summary Table of Porter’s Stages
| Stage | Main Source of Edge | Role of Technology | Industry Examples |
| Factor-Driven | Raw materials / Cheap labor | Imported / Basic | Mining, Agriculture |
| Investment-Driven | Scale / Efficiency | Adopted & Improved | Steel, Electronics assembly |
| Innovation-Driven | R&D / Brand / Design | Created Locally | AI, Biotech, Aerospace |
| Wealth-Driven | Past Wealth / Protection | Stagnant / Status Quo | Mature Finance, Monopolies |
How is the world economy in transition?
In 2026, the world economy is undergoing a fundamental “reset,” moving away from the post-WWII liberal order toward a system defined by geopolitical blocs, AI-driven productivity, and green industrial policy.
The transition can be summarized as a shift from a world that prioritized efficiency and open markets to one that prioritizes resilience, security, and technological sovereignty.
1. Geoeconomic Fragmentation (The “Bloc” Economy)
The most visible transition is the move from a unipolar, US-led globalization to a more fragmented, multipolar world.
- Reglobalization: Trade is not disappearing, but it is “rewiring.”1 Instead of global integration, we see the rise of distinct economic blocs (e.g., US-led vs. China-led).
- The Tariff Era: As of 2026, the US effective tariff rate has stabilized at much higher levels (around 15%) compared to the pre-2020 era. This has forced companies to move from “Global Supply Chains” to “Regional Supply Hubs.”
- Bridge Nations: Countries like Vietnam, Mexico, and India have become the “connectors,” acting as neutral ground where different blocs still conduct essential business.
2. The Technological Transition: From Hype to “Reckoning”
2026 is being called the year of the AI Reckoning.2 After years of massive investment, the world economy is transitioning from experimenting with AI to measuring its real impact on GDP.
- The Productivity Flywheel: In sectors like software, healthcare, and logistics, AI is finally starting to show measurable gains in “Total Factor Productivity.”3
- The K-Shaped Labor Market: We are seeing a widening gap between “Innovation Leaders” (firms and workers who have mastered AI) and those being displaced by automation.
- The Industrial Renaissance: AI is moving into the physical world through “Digital Twins” and advanced robotics, reshaping manufacturing in the US and Europe.4
3. The Energy & Sustainability Pivot
The transition to a “Green Economy” has become a matter of national security rather than just environmental policy.
- AI’s Energy Paradox: The massive energy demand of AI data centers is actually accelerating the clean energy transition, as tech giants invest billions in nuclear and renewable power to secure their own electricity supplies.5
- Green Protectionism: Tools like the EU’s Carbon Border Adjustment Mechanism (CBAM) are now active, meaning a country’s carbon footprint is officially a trade barrier.
- Circular Economy: Nations are transitioning from “extract-and-waste” models to “circular” supply chains to reduce their dependence on volatile foreign raw materials.
4. The Shift in Economic Development Stages
Many nations are currently stuck in a difficult transition between Porter’s stages:
- China’s Pivot: China is aggressively attempting to move from an Investment-Driven economy (building infrastructure/real estate) to an Innovation-Driven one (leading in EVs, green tech, and AI) to escape its domestic growth slowdown.
- India’s Rise: India is in a high-speed Investment-Driven phase, using massive government subsidies to become the world’s new “office and factory.”
Comparison: The Old vs. New Economic Era
| Feature | The Old Era (1990–2020) | The New Era (2026+) |
| Priority | Cost Efficiency (Just-in-Time) | Security & Resilience (Just-in-Case) |
| Trade Policy | Free Trade / WTO Norms | Managed Trade / Bilateral Deals |
| Key Resource | Cheap Labor / Oil | Data / Compute / Rare Minerals |
| Inflation | Generally Low & Stable | “Sticky” & Volatile |
| Leadership | Unipolar (Pax Americana) | Multipolar / Fractured |
How can the composition of world trade be described?
In 2026, the composition of world trade can be described by three major shifts: the dominance of services over physical goods, the AI-driven hardware boom, and the rise of green-tech commodities.
While total trade growth is cooling (projected at 2.5%–3% for 2026), the mix of what is being traded is changing rapidly.
1. The Goods vs. Services Divergence
The most fundamental shift in trade composition is the “decoupling” of service growth from manufacturing.
- Resilient Services: Trade in commercial services (telecommunications, computer services, and licensing) is growing at roughly double the rate of merchandise trade.1
- Digitally Deliverable Services: These now account for nearly 25% of total global trade. This includes everything from streaming and software-as-a-service (SaaS) to AI model licensing.
- Stagnant Merchandise: Physical goods trade is slowing due to higher tariffs and a move toward domestic production.2 Intermediate goods (parts and components) have seen their share of global trade drop to approximately 48.5% as supply chains shorten.3
2. The AI-Industrial Pivot
As of 2026, “AI-related goods” are no longer a niche category; they have become the primary engine of merchandise trade growth.4
- Central Driver: Semiconductors, high-end servers, and specialized telecommunications equipment accounted for nearly half of all global trade expansion in the past year.5
- High-Value Concentration: While these products make up less than 10% of total trade volume, they represent a massive share of trade value due to the high cost of advanced GPUs and AI hardware.
- Infrastructure Imports: Massive demand for the physical components of data centers (cooling systems, transformers, and copper wiring) is creating new “super-corridors” of trade between high-tech designers and resource-rich nations.6
3. The “New Commodity” Basket
The traditional dominance of oil and gas in commodity trade is being challenged by the minerals required for the energy transition.
- Critical Minerals: Lithium, cobalt, copper, and rare earth elements now command a growing share of the global commodity mix.
- Green Tech Exports: The global market for green technologies (EVs, solar panels, and wind turbines) is expanding rapidly, with trade in these goods projected to reach $2.1 trillion by 2030.7
- Agricultural Resilience: Food and agricultural products remain a stable ~8-10% of trade, though price volatility in staples like rice and wheat has increased the value share of these flows for low-income nations.
4. Geographic Composition: The Rise of the Global South
Where trade is happening is changing as much as what is being traded.
- ASEAN & Africa: These regions are becoming the new centers of demand.8 Southeast Asian nations (Vietnam, Indonesia, Thailand) are significantly increasing their imports of machinery and pharmaceuticals as they industrialize.9
- The “Bridge” Role: Mexico and Canada have solidified their roles as the primary trade partners for the US, often acting as the final assembly point for goods with components sourced globally.
- China’s Evolution: China’s export mix has moved sharply toward high-value “clean energy” products and advanced electronics, while its imports of integrated circuits have slowed as it pursues “technological sovereignty.”
Summary Table: World Trade Composition 2026
| Category | Trade Status | Key Drivers |
| Digital Services | Booming | AI, Remote work, Streaming, SaaS. |
| AI Hardware | High Value | High-end chips, Data center infrastructure. |
| Intermediate Goods | Shrinking | Near-shoring, Friend-shoring. |
| Green Energy | Rising | EV batteries, Solar, Critical minerals. |
| Fossil Fuels | Volatile | Geopolitical shifts, Long-term transition. |
How can the state of the world economy be described?
In early 2026, the world economy is characterized by a “sturdy but diverging” expansion. We have largely moved past the immediate post-pandemic chaos, but we are now grappling with the long-term consequences of high debt, geopolitical realignment, and the first real productivity shifts from Artificial Intelligence.
The current state can be described through four defining themes:
1. Divergent Growth Paths
Global GDP growth for 2026 is projected to hover between 2.8% and 3.2%. However, this average masks a massive “K-shaped” split between regions:
- The US “Sturdy” Outperformance: Despite high interest rates, the US remains a primary engine of growth (projected ~2.6%), fueled by massive AI investment and resilient consumer spending.1
- China’s Structural Struggle: Growth has moderated to roughly 4.5%–5%. While its manufacturing and EV exports are at record highs, its domestic economy is weighed down by a persistent real estate crisis and weak internal demand.
- The Eurozone’s Slow Recovery: Growth remains modest (around 1.3%). Germany is slowly rebounding thanks to new defense and green infrastructure spending, while Southern Europe (Spain and Portugal) continues to outperform the northern states due to service-sector strength.
2. The AI Productivity “Inflection Point”
2026 is the year AI shifted from a stock market hype cycle to a measurable economic factor.
- Capex Boom: Business investment is bifurcated. Spending on “non-tech” equipment is sluggish, but capital expenditure (Capex) on AI hardware and data centers is at an all-time high.2
- Efficiency Gains: We are seeing the first clear signs of Total Factor Productivity (TFP) increases in “digitally native” sectors like finance, legal services, and software development, which is helping to keep global inflation from re-accelerating.
3. The “Sticky” Inflation & Rate Pivot
Inflation has generally cooled from the 2022–2023 peaks but remains “sticky” around 3% in many regions.3
- The Great Unwinding: Most major central banks (The Fed, ECB, and BoE) are in a “normalization” phase. In 2026, we expect policy rates to settle toward a neutral range of 3.0%–3.5%.
- Tariff Headwinds: New trade barriers and tariffs (averaging 14%–16% in some corridors) act as a “permanent” inflationary tax, preventing prices from returning to pre-2020 levels.
4. Fiscal Fragility & The “Debt Vise”
A major shadow over the 2026 economy is the state of public finances.4
- Record Debt: Global public debt is approaching 100% of global GDP. Governments are caught in a “vise”—they need to spend on defense, the energy transition, and aging populations, but high interest rates have made servicing existing debt much more expensive.5
- Limited Buffers: Unlike the 2008 or 2020 crises, many nations have “run out of ammunition,” leaving the world economy more vulnerable to any new sudden shocks (e.g., a regional conflict or a financial market correction).
2026 Macroeconomic Scorecard
| Indicator | Status | 2026 Trend |
| Global GDP | 3.1% | Stable but underwhelming. |
| Inflation | ~3% | Falling slowly; “sticky” in services. |
| Monetary Policy | Easing | Rates moving toward 3% “neutral.” |
| Trade | Fractured | Growing in blocs; slowed by tariffs. |
| Employment | Stagnant | Low unemployment, but job growth is slowing. |
Is there a paradigm shift in how international economic activity can be described?
In 2026, the paradigm shift in international economic activity can be described as the transition from “Hyper-globalization” (efficiency-first) to “Reglobalization” (security-first).
This isn’t an end to global trade, but a fundamental change in its logic. For three decades, the goal was to find the cheapest possible source for every component. Today, the new paradigm prioritizes resilience, geostrategy, and technological sovereignty.
1. The Core Paradigm Shift
The most significant change is the move away from the “Pax Americana” model—where the US provided the global “public goods” (defense, dollar-clearing, and open markets) for everyone—toward a more Multipolar Order.
| Feature | The Old Paradigm (Efficiency) | The New Paradigm (Reglobalization) |
| Primary Goal | Minimize cost / Maximize profit. | Minimize risk / Maximize security. |
| Supply Chain | “Just-in-Time” (Zero waste). | “Just-in-Case” (Buffering & Diversification). |
| Trade Logic | Global Value Chains (GVCs). | Regional/Multipolar Value Chains (RVCs). |
| Key Metric | Comparative Advantage (Price). | Strategic Autonomy (Access to Tech/Energy). |
2. From “GVCs” to “RVCs” (Regional Value Chains)
We are moving from a single, globally integrated system to Regional Blocs.
- The “Bridge” Strategy: Nations like Vietnam, Mexico, and India are the new “nodes” that allow companies to maintain global reach while staying within friendlier geopolitical borders (known as Friend-shoring).
- Fragmentation: As of 2026, we see a distinct split between the US-led and China-led economic spheres. Trade within these blocs is intensifying, while trade between them is becoming highly specialized and restricted to non-sensitive goods.
3. The “AI-Driven” Productivity Shift
International activity is now described through the lens of Compute and Intelligence.
- The New Capital: In 2026, a nation’s competitive advantage is defined by its “AI Readiness”—its access to GPUs, sovereign data sets, and the specialized energy grids needed to power them.
- Agentic Trade: AI agents are beginning to manage cross-border procurement independently, choosing routes and suppliers in real-time to bypass port congestion or sudden tariff changes, making trade more “liquid” but less predictable for traditional models.
4. The Green Transition as a Trade Barrier
Sustainability has shifted from a corporate social responsibility (CSR) goal to a hard trade filter.
- Carbon Border Adjustments: Policies like the EU’s CBAM have turned a product’s carbon footprint into an official trade cost.
- Commodity Realignment: Global trade flows are being rewritten by the demand for “Green Commodities” (Lithium, Copper, Cobalt). Nations with these resources are the new “energy giants,” similar to the oil-rich states of the 20th century.
5. Summary: A Supply-Side Paradigm
Economic activity is no longer just about stimulating “Demand” (getting people to buy more). In 2026, the focus is almost entirely on the Supply Side:
- Energy Sovereignty: Can we power our industries?
- Tech Sovereignty: Can we build our own AI and chips?
- Labor Resilience: Can we automate what we can’t find workers for?
What were the major global trade flows in the 1990s?
In the 1990s, global trade entered a period of hyper-globalization, transforming from a system of simple exchange into a complex web of production. This decade was defined by the collapse of the Soviet Union, the rise of the internet, and the birth of the World Trade Organization (WTO) in 1995.
The trade patterns of the 1990s can be described by three core features: the “Triad” dominance, the birth of Global Value Chains (GVCs), and the emergence of China.
1. The Triad Dominance
In the 1990s, the world economy was “unipolar” or “tripolar,” with three regions—the United States, Western Europe (the EU), and Japan—controlling the vast majority of global trade value.1
- The Hubs: Almost all major trade flows either started or ended in one of these three regions.
- The US Role: The United States was the world’s primary consumer, importing massive amounts of manufactured goods from Japan and the emerging “Tiger” economies (South Korea, Taiwan, Hong Kong, and Singapore).
- Intra-EU Trade: With the completion of the European Single Market in 1993, trade within Europe exploded, becoming the densest network of trade in the world.2
2. The Rise of Global Value Chains (GVCs)
This was the decade when the “Made in [Country]” label started to lose its meaning. Companies began “slicing up” their production processes.3
- Fragmentation: Instead of building an entire car or computer in one factory, firms relocated specific tasks to where they could be done most cheaply.
- Intermediate Goods: For the first time, trade in parts and components (intermediate goods) began to outpace trade in finished products.4 By the late 1990s, roughly 50% of trade was in these intermediate inputs.
- The Drivers: This shift was made possible by the “Twin Revolutions”:
- The Shipping Container: Drastically lowered the cost of moving physical goods.
- The Internet: Allowed managers to coordinate complex production across borders in real-time.
3. The Emergence of China and the “Tiger” Economies
While China was not yet the “World’s Factory” in the early 90s, the decade laid the groundwork for its explosion.
- Special Economic Zones (SEZs): China’s focus on export-led growth through zones like Shenzhen began to pull manufacturing away from traditional hubs.
- The Export Shift: In 1990, China accounted for only ~2% of global commodity trade.5 By the end of the decade, it had become a major exporter of textiles, toys, and basic electronics.
- Integration: The decade ended with a historic milestone: China’s preparations to join the WTO (which it officially did in 2001), signaling the end of the “Triad-only” era.
4. Key Commodity Patterns
Commodity flows in the 1990s were relatively stable compared to the volatility seen in the 21st century.
| Commodity Group | 1990s Trend | Key Trade Flow |
| Crude Oil | Low and stable prices ($15–$20/bbl). | Middle East $\rightarrow$ USA, Japan, Europe. |
| Automobiles | High-value dominance. | Japan/Germany $\rightarrow$ USA. |
| Electronics | Shift from analog to digital. | SE Asia $\rightarrow$ Global Markets. |
| Agriculture | High subsidies in the West. | USA/EU $\rightarrow$ Global South. |
Summary: The 1990s vs. Today (2026)
- 1990s: Trade was about Efficiency. Globalization was seen as an unstoppable, positive force that would bring world peace through “commercial integration.”
- 2026: Trade is about Resilience. Globalization is being managed and restricted to ensure national security and supply chain stability.
What was the global trade flow of microelectronics?
The global trade flow of microelectronics (semiconductors) has evolved from a relatively simple exchange between a few industrial giants into the most complex and geostrategically sensitive trade network on Earth.
By 2026, this network has moved from a “Global Value Chain” (maximizing efficiency) to a “Securitized Value Chain” (maximizing resilience).
1. The 1990s: The Era of “The Triad”
In the 1990s, microelectronics trade was dominated by three main hubs: The United States, Japan, and Western Europe. * Japan’s Dominance: At the start of the decade, Japan was the world leader in memory chips (DRAM) and consumer electronics components.
- The US Focus: The United States led in high-value microprocessor design (Intel, AMD) and software, but began outsourcing “low-value” assembly to Southeast Asia.
- The Rise of the “Tigers”: South Korea (Samsung) and Taiwan (TSMC) began their ascent, moving from simple assembly to sophisticated manufacturing, often supported by technology transfers from the US and Japan.
2. 2000s–2010s: Hyper-Specialization
During this period, the industry fragmented into a highly efficient, inter-dependent global machine.
- The “Fabless” Revolution: US firms increasingly focused only on designing chips, while a few “foundries” in Asia—most notably TSMC in Taiwan—focused exclusively on manufacturing them.
- China as the Assembly Hub: China became the world’s largest importer of chips, not for its own consumption, but to assemble them into global products like iPhones and laptops.
- The Single Point of Failure: By 2019, nearly 90% of the world’s most advanced chips were flowing through a single point: Taiwan.
3. 2026: The “Small Yard, High Fence” Paradigm
As of 2026, the trade flows have been “rewired” due to national security concerns and the AI revolution.1
A. The Geographic Shift (Reshoring)
Governments are spending hundreds of billions to move manufacturing closer to home.
- Arizona & Ohio (USA):2 New “mega-fabs” from Intel and TSMC have started volume production, beginning to redirect flows that previously went only to East Asia.
- Magdeburg (Germany):3 Europe is attempting to double its global chip share to 20%, creating a new high-tech corridor in Central Europe.
B. The AI Supercycle Flow
AI has created a massive new trade “super-corridor”:
- Design: US (Nvidia/Apple) $\rightarrow$ Manufacturing: Taiwan (TSMC) $\rightarrow$ High-Bandwidth Memory: South Korea (SK Hynix/Samsung) $\rightarrow$ Final Assembly: Global Data Centers.4
- HBM Dominance: South Korea now controls ~75% of the world’s DRAM/HBM trade, making it a critical “chokepoint” in the AI supply chain.
C. The Bifurcated Market
There are now two distinct, parallel trade flows emerging:
- Leading-Edge Flow (2nm–5nm): Restricted trade involving the US, Taiwan, South Korea, Japan, and the Netherlands (ASML). China is largely blocked from this flow by export controls.
- Legacy/Mature Flow (28nm+): Dominated increasingly by China, which has pivoted to becoming the world’s “foundry” for the everyday chips used in cars, appliances, and industrial sensors.
4. Summary of Microelectronics Trade Evolution
| Feature | 1990s Pattern | 2026 Pattern |
| Top Exporter | Japan / USA | Taiwan / South Korea / China |
| Trade Driver | PCs & Consumer Electronics | AI, EVs, and Data Centers |
| Logic | “Just-in-Time” (Cost) | “Strategic Autonomy” (Security) |
| Chokepoint | Raw Silicon | EUV Lithography & Advanced Packaging |
What was the global trade flow of automobiles?
The global trade flow of automobiles has transitioned from a concentrated “Triad” model (US, EU, Japan) in the 1990s to a fragmented, “regionalized” system in 2026, dominated by the rise of China and the shift toward Electric Vehicles (EVs).
In 2026, the automotive industry is no longer just about moving finished cars; it is a battle for control over battery supply chains and software-defined platforms.1
1. The 1990s: The Era of Traditional Powerhouses
In the 1990s, the automotive trade was a story of a few established giants exporting high-value internal combustion engine (ICE) vehicles to the rest of the world.
- The Hub-and-Spoke Model: Global trade was centered on three hubs: Japan, Germany, and the United States.
- The Japanese Surge: Japan was the world’s leading exporter, shipping millions of fuel-efficient cars (Toyota, Honda) to the US and Europe. This led to “trade frictions” and forced Japanese firms to open “transplant” factories in the US South (e.g., Kentucky, Tennessee).
- The Birth of Regional Blocs: Trade agreements like NAFTA (1994) began integrating the North American market, moving parts and assembly to Mexico, while Western European firms integrated the newly opened markets of Eastern Europe (Slovakia, Czechia).
- China’s Role: In the 90s, China was an insignificant player in trade, producing fewer than 2 million vehicles annually, mostly through joint ventures with Western firms like VW for its domestic market.
2. 2026: The “Great Electric Realignment”
As of 2026, the map of automotive trade has been completely redrawn. The transition from engines to batteries has changed not only what is traded, but who holds the power.
A. China: The New Global Export Hub
By 2026, China has overtaken Japan as the world’s largest automobile exporter.
- EV Dominance: China accounts for roughly 60% of global EV sales and is a massive exporter of EVs to Europe, Southeast Asia, and South America.
- The Battery Chokepoint: Even when cars are assembled elsewhere, the core trade value (the battery) often flows out of China, which controls the majority of global lithium-ion cell production.
B. The Rise of “Fortress” Markets (Trade Barriers)
In 2026, we see a “bifurcation” of trade flows due to protective tariffs:
- The US-Mexico-Canada (USMCA) Bloc: The US has largely closed its market to Chinese-made EVs through heavy tariffs (approaching 100% in some cases).2 This has forced a flow of “near-shoring” investment into Mexico and Canada to meet local content requirements.
- The EU’s Balancing Act: Europe is a major importer of Chinese EVs but has implemented “anti-subsidy” duties to protect its domestic industry (VW, Stellantis, Renault).
C. Emerging “Secondary Hubs”
- Thailand & India: These nations have emerged as major exporters for their respective regions. Thailand has become the “Detroit of Asia” for Japanese firms, while India is scaling up exports of small, affordable EVs to the Global South.
3. Comparison of Trade Flows: 1990 vs. 2026
| Feature | 1990s Trade Flow | 2026 Trade Flow |
| Top Exporter | Japan | China |
| Main Product | Sedans & Compact ICE cars | SUVs, Trucks, and EVs |
| Key Value Driver | Precision Engineering (Engines) | Battery Chemistry & Software |
| Trade Logic | Global Exports from Hubs | “Produce Where You Sell” (Regional) |
| Major Importer | USA (High Volume) | USA & EU (High Value / Security Focused) |
4. The 2026 “Software-Defined” Flow
A new, invisible trade flow has emerged in 2026: Data and Software.
- Modern cars are “computers on wheels.” Trade now includes the cross-border flow of software updates, navigation data, and AI training models.
- Security Concerns: This has led to new “digital trade barriers,” where countries (like the US) restrict the import of vehicles with Chinese-made telematics and autonomous driving software due to data privacy risks.
What was the global trade flow of steel?
The global trade flow of steel has undergone a massive structural shift, moving from a Western-dominated “industrial base” model in the 1990s to a highly protected, China-centric, and increasingly “green” market in 2026.
In the 1990s, steel was a symbol of national industrial strength; in 2026, it is a battleground for carbon policy and trade defense.
1. The 1990s: The Era of “Big Steel” & The Triad
In the 1990s, the global steel trade was relatively balanced between the established industrial powers.
- The Producers: The United States, Japan, and the Soviet Union (and later Russia) were the primary drivers. Japan and Germany were the world’s leading exporters of high-quality specialized steel.
- The Flow: High-value steel moved from Japan and Europe to the United States to feed its booming automotive and construction sectors.
- China’s Infancy: In 1990, China produced only about 10% of the world’s steel. It was a net importer, buying steel from the West and Japan to build its early infrastructure.
- Trade Policy: This decade saw the rise of “Antidumping” duties as US and European firms struggled to compete with lower-cost imports from Japan and South Korea.
2. 2026: The “Green” and “Protected” Market
As of 2026, the global trade flow of steel is defined by China’s massive overcapacity, India’s rapid rise, and the “decarbonization” of trade routes.
A. China’s Dominance and the “Export Surge”
- The Titan: China now accounts for over 50% of total global steel production (roughly 1 billion tonnes annually).1
- The Export Pressure: Due to a slowing domestic real estate market in 2026, China is exporting record amounts of steel (projected at ~109 million tons this year).2 This “flood” of low-priced steel has triggered a global wave of protectionism.3
B. The Rise of India (The New Hub)
- High-Speed Growth: India has solidified its position as the world’s second-largest steel producer.
- Flow Shift: Unlike China, India is consuming the vast majority of its own steel for massive domestic infrastructure projects, though it has begun exporting to Southeast Asia and the Middle East.
C. “Green Steel” & CBAM (The New Trade Barrier)
The most significant paradigm shift in 2026 is the Carbon Border Adjustment Mechanism (CBAM).
- The “Carbon Tax”: As of January 2026, the EU has begun imposing carbon fees on imported steel.4
- The Rewiring: Trade flows are shifting away from “dirty” coal-based steel (from China and India) toward “green” steel produced using green hydrogen or electric arc furnaces (EAF).
- Premium Markets: Nations like Sweden, Germany, and Canada are becoming “Green Steel hubs,” exporting premium, low-carbon steel to manufacturers who need to meet strict environmental targets.
3. Comparison of Steel Trade: 1990 vs. 2026
| Feature | 1990s Steel Trade | 2026 Steel Trade |
| Top Producer | USSR / Japan / USA | China |
| Growth Leader | South Korea / Taiwan | India / Vietnam |
| Trade Logic | Efficiency & Price | Carbon Footprint & Security |
| Main Tech | Blast Furnaces (Coal) | Shift to Electric Arc & Hydrogen |
| Trade Barriers | Antidumping Duties | CBAM (Carbon Fees) & 25% Tariffs |
4. Geographic Summary 2026
- The United States: Has largely “walled off” its market with 25% tariffs (Section 232) to protect domestic producers like Nucor and Cleveland-Cliffs.5
- The European Union: Is focusing on “Strategic Autonomy,” using CBAM to prevent “carbon leakage” from cheaper, high-emission foreign steel.6
- Southeast Asia: Remains a contested battleground, importing massive volumes of Chinese steel while trying to build its own domestic capacity.
What was the global trade flow of textiles and clothing?
In 2026, the global trade in textiles and clothing has reached a pivotal “Circular Crossroads.” While the 1990s were defined by the move toward low-cost, mass-market manufacturing, today’s trade is being reshaped by ultra-fast fashion data flows, sustainability mandates, and a “New Regionalism.”
The evolution from the 1990s to 2026 reflects a shift from “Managed Protectionism” to “Digital Hyper-efficiency.”
1. The 1990s: The Multi-Fibre Arrangement (MFA) Era
In the 1990s, the textile trade was a “managed” market. Unlike other goods, clothing was subject to strict import quotas designed to protect Western domestic manufacturers.1
- The Quota Game: Under the Multi-Fibre Arrangement (MFA), developed nations (US, EU) set limits on how many shirts or pants could be imported from specific developing nations.2 This unintentionally spread manufacturing to “non-quota” countries like Bangladesh and Sri Lanka, which otherwise might not have entered the market.
- The “Triad” Consumption: Demand was heavily concentrated in the US, Europe, and Japan.
- China’s Ascent: Although still under quotas, China began consolidating its position as the premier textile supplier due to its massive scale and integrated supply chains.
2. 2026: The Ultra-Fast and “Circular” Paradigm
As of 2026, the trade flows are no longer governed by quotas, but by algorithms and environmental regulations.
A. The “Shein-ification” of Trade
The dominant flow today is Direct-to-Consumer (D2C) from Asian hubs to Western doorsteps.
- Data-Driven Flows: Platforms like Shein and Temu have pioneered a “small batch” trade model. Instead of shipping massive containers to warehouses, thousands of individual parcels are flown daily via air freight, bypassing traditional bulk-trade statistics.
- China’s Value Shift: While China’s share of finished garment exports has dipped to ~30%, its share of textile exports (fabrics and yarns) has surged to over 43%, as it now supplies the raw materials for the “New Tigers” like Vietnam and Bangladesh.3
B. The Rise of “Fortress Europe” (Sustainability)
2026 marks a regulatory turning point for clothing trade.
- EU Waste Ban: As of this year, the EU has officially banned the destruction of unsold clothes and shoes.4
- Digital Product Passports (DPP): Every garment traded into the EU must now have a digital twin that tracks its origin and materials. This has created a new trade flow: Traceability Data.
- Secondhand Trade Reverse-Flows: A massive secondary market has emerged.5 The “Global North” now exports millions of tonnes of used clothing to the “Global South” (notably Ghana, Chile, and Pakistan), which is increasingly being regulated as “waste trade.”
3. Top Exporters and Importers in 2026
| Role | Top Players (2026) | Market Specialty |
| Exporter #1 | China | High-tech fabrics, synthetic fibers, and D2C apparel. |
| Exporter #2 | Bangladesh | Volume-based cotton garments (T-shirts, denim). |
| Exporter #3 | Vietnam | High-end sportswear and technical outerwear. |
| Importer #1 | European Union | Highest value market; primary driver of “green” standards. |
| Importer #2 | United States | Largest volume consumer; currently diversifying away from China. |
4. Summary: 1990 vs. 2026
- 1990s Logic: Quota-Driven. Trade was restricted by political deals to prevent “market disruption” in the West.6
- 2026 Logic: Resilience and Circularity. Trade is driven by high-speed digital trends, but constrained by new laws against “fast-fashion waste” and carbon footprints.7
What was the global trade flow of grains and feed?
In 2026, the global trade flow of grains and feed has entered a state of “Fragile Abundance.” While total production has reached record highs, the trade routes themselves have been fundamentally altered by a decade of geopolitical shocks, climate-driven shifts in “breadbasket” locations, and the rising demand for animal protein in the Global South.
The evolution from the 1990s to 2026 reflects a transition from a US-centric “superpower” model to a highly diversified and competitive multipolar market.
1. The 1990s: The Era of American Dominance
In the 1990s, the grain trade was relatively simple: the United States was the world’s “super-exporter.”1
- The US Share: The United States controlled roughly 70% of global corn exports and one-third of the world’s wheat exports.2
- The Main Flows: Grain flowed primarily from the US and Canada to Europe, Japan, and the emerging “Tiger” economies of East Asia.
- Russia & Ukraine’s Absence: During the 1990s, the former Soviet states were often net importers of grain as they struggled with the transition to market economies.
- Stable Origins: Sourcing was predictable; if you needed wheat or corn, you looked to the Americas.
2. 2026: The Multipolar Realignment
By 2026, the US share of the grain trade has significantly declined as new “power-exporters” have emerged, particularly in the Black Sea and South America.
A. The Black Sea Dominance
- Russia’s Ascent: Russia is now the world’s largest wheat exporter, accounting for roughly 21% of global exports in 2026.3 Its grain moves primarily to the Middle East, North Africa, and Southeast Asia.
- Ukraine’s Resilience: Despite years of conflict, Ukraine remains a critical “top 5” exporter, having recalibrated its logistics to use a mix of Danube river routes and overland rail into the EU.
B. The South American “Soy and Corn” Engine
- Brazil’s Record Year: In 2026, Brazil has solidified its lead as the world’s largest soybean exporter and is making massive inroads into the corn and sorghum markets, often displacing US shipments to China.
- Argentina’s Rebound: After years of drought in the early 2020s, Argentina has returned to full strength in 2026, serving as a key competitor in the wheat and maize markets.4
C. The China “Demand Pivot”
- The Largest Importer: China remains the world’s largest grain importer, but in 2026, it has aggressively diversified its sourcing. To reduce reliance on the US, China has redirected the majority of its corn and soy purchases to Brazil and Argentina.
- Domestic Stocks: In 2026, China holds record levels of grain reserves, a “security buffer” against global price volatility.
3. Comparison of Trade Flows: 1990 vs. 2026
| Feature | 1990s Grain Trade | 2026 Grain Trade |
| Dominant Exporter | United States (70% Corn share) | Russia (Wheat) / Brazil (Soy & Corn) |
| Emerging Player | South American Soybeans | India & Ukraine (Diversified) |
| Trade Logic | Lowest Price / WTO Liberalization | Food Security & Geostrategy |
| Major Importers | Japan, EU, Developing Nations | China, SE Asia, North Africa |
| Key Disruptor | High Subsidies (US/EU) | Climate Volatility & Biofuels |
4. The 2026 “Feed vs. Fuel” Conflict
A major pattern in 2026 is the competition for grain between humans, animals, and machines.
- The Feed Boom: As incomes rise in India, Vietnam, and Indonesia, the demand for meat has surged. This has created massive new trade flows of “coarse grains” (maize and barley) into Southeast Asia for livestock feed.
- Biofuel Mandates: In 2026, a significant portion of global grain production is diverted to “Green Fuel” mandates. This creates a floor for prices, making food more expensive for net-importing nations in Africa.
5. Climate-Driven “Breadbasket” Shifts
As of 2026, we are seeing the first permanent rewiring of trade due to global warming:
- The “Northern” Gain: Wheat cultivation is moving further north. Canada and Russia are seeing increased yields and expanded acreage, while traditional “southern” breadbaskets like Australia and parts of the US Midwest are facing more frequent “heat-stress” events.
- Infrastructure Bottlenecks: Low water levels in the Mississippi River and the Panama Canal have made US grain exports more expensive, further helping South American competitors in 2026.
What was the global trade flow of nonoil commodities?
In 2026, the trade flows of non-oil commodities—which include metals, minerals, and agricultural products—have become the new “strategic frontier” of international business.
While the 1990s were characterized by a “Buyer’s Market” focused on low-cost raw materials, 2026 is defined by structural scarcity, resource nationalism, and the “Green Premium.”
1. The Metals & Minerals Pivot (The “New Energy” Flow)
In the 20th century, oil was the primary commodity used for geopolitical leverage. In 2026, that power has shifted to Critical Minerals required for AI infrastructure and the energy transition.1
- Copper as the “New Oil”: Copper has officially become the strategic backbone of global trade.2 In 2026, we see a massive flow of copper from Chile, Peru, and Zambia toward the US and China. The US has recently added copper to its “Critical Minerals” list, triggering a race to secure shipments before new tariffs take effect.3
- The Rare Earth Monopoly: China continues to dominate the processing of rare earth elements (controlling ~95% of certain segments).4 In 2026, trade flows are bifurcating: China is deepening ties with resource-rich African nations, while Western nations are attempting to build a parallel supply chain via Australia and Canada.
- Precious Metals at Record Highs: Gold and silver are seeing record trade volumes in 2026. Gold is being traded less as a “jewelry” item and more as a “sovereign reserve” as central banks diversify away from the US dollar. Silver has transitioned from a monetary metal to a high-tech industrial input, driven by demand from the solar and EV sectors.5
2. Agricultural Flows: Resilience over Efficiency
The agricultural trade in 2026 is grappling with “Agroindustry Stagflation”—a period of high inventory but flat demand in aging Western economies.6
- The Multipolar Breadbasket: In the 1990s, the US was the undisputed grain supermarket. In 2026, the flow has shifted:
- Brazil has solidified its lead as the world’s top soybean and beef exporter.
- India is a dominant force in rice and spices, though it frequently uses “export bans” as a tool for domestic price control.7
- Russia remains the world’s largest wheat exporter, with flows primarily moving to the Middle East and North Africa (MENA) region.
- “Green Trade Corridors”: A new pattern in 2026 is the “traceable” crop.8 Due to EU regulations, agricultural flows now include digital passports that prove a product did not contribute to deforestation. This has created a “premium” flow for certified sustainable crops and a “discounted” flow for conventional commodities.
3. Comparison of Non-Oil Commodity Flows
| Category | 1990s Flow Pattern | 2026 Flow Pattern |
| Metals | Low-cost industrial inputs for Japan/West. | Strategic “scarcity” assets for AI and EVs. |
| Precious Metals | Primarily jewelry and dental. | Central bank reserves and tech inputs. |
| Grains | US-dominated surplus flow. | Diversified (Brazil, Russia, India). |
| Resource Policy | Open markets / WTO focus. | Resource Nationalism (Export taxes/bans). |
4. Key 2026 Themes: Resource Nationalism & M&A
- The Bargaining Power Shift: In 2026, mining-dependent nations (Zambia, Mongolia, Peru) are asserting more control.9 Zambia, for instance, has recently renegotiated agreements to increase government stakes in copper projects from 25% to nearly 40%.
- The M&A Surge: There is an intense wave of Mergers and Acquisitions in the mining sector.10 Automotive and tech firms (like Tesla or Nvidia) are no longer just “buyers”; they are becoming investors in mines to bypass traditional trade markets and secure their own mineral flows.
- Digital Integration: For the first time, commodity flows are being modeled in real-time using Blockchain-based traceability, allowing buyers to see the exact mine or farm their product originated from to comply with new environmental laws.
What are the regional patterns of world trade?
In 2026, the regional patterns of world trade have moved from a “global village” model to a “bloc-and-connector” system. While trade values are reaching record highs (exceeding $35 trillion), the geographic flow is becoming increasingly fragmented into distinct geopolitical spheres.
The current patterns are defined by the rise of “South-South” trade, the strengthening of regional integration, and the critical role of “connector” states.
1. The Rise of the “South-South” Corridor
The most significant shift in 2026 is the explosion of trade between developing nations (South-South trade), which grew by approximately 8% over the last year.
- East Asia & Africa: These are the primary engines of global trade growth. Intra-regional trade in East Asia surged by 10% in late 2025, driven by a massive demand for electronics and AI-related hardware.1
- New Consumer Markets: Africa and Southeast Asia have transitioned from being just “resource exporters” to major demand centers.2 Countries like Vietnam, Indonesia, and Nigeria are seeing double-digit growth in imports of manufactured goods and medical equipment.
2. Regional Integration vs. Global Fragmentation3
Nations are increasingly trading with their neighbors to hedge against geopolitical volatility.
- Europe: Still the world leader in regional integration. Intra-EU trade is 1.6 times higher than its trade with the rest of the world.4
- North America (USMCA): The “North American Bloc” has deepened as the US and Canada move in lockstep. The region has seen a surge in trade related to critical minerals (copper, uranium, nickel) needed for AI data centers and defense.
- ASEAN: This region has become a central “hub” for global trade, with negotiations for a Canada-ASEAN free trade agreement expected to conclude in 2026, further linking the Indo-Pacific to North American markets.5
3. The “Connector” States (The Trade Rewirers)
As the US-China rivalry creates a “small yard, high fence” trade environment, a group of neutral “Connector States” has become indispensable for global stability.
- The Bridge Role: Countries like Vietnam, Mexico, and Hungary serve as the physical junctions where Eastern and Western supply chains still meet.6
- Trade Rerouting: When direct US-China flows are restricted, products are often rerouted through these nations. For example, China’s exports to ASEAN have spiked by nearly 19% as it seeks to bypass direct tariffs to the West.
4. Regional Performance Scorecard (2026 Forecast)
| Region | Export Trend | Key Strategic Focus |
| East Asia | Robust (+9%) | AI hardware, Semiconductors, EVs. |
| North America | Moderate | Energy security, Critical minerals, AI services. |
| European Union | Slow Growth | Green transition, Carbon Border Taxes (CBAM). |
| Africa | Strong (+6%) | South-South trade, Urbanization demand. |
| Latin America | Mixed | Resource nationalism, Agri-exports (Brazil). |
5. Summary: A Fragmented Future
By the end of 2026, it is projected that 30% of global trade will be “canalized” into either China-led or US-led corridors. Efficiency is no longer the primary driver of regional patterns; instead, economic security and strategic alliances dictate who trades with whom.7
WTO Global Trade Outlook and Statistics 2026
This video provides a deep dive into the WTO’s 2026 projections, explaining why merchandise trade growth is slowing while services and AI-related products continue to reshape regional patterns.
How about North America?
In 2026, North American trade is defined by a high-stakes “moment of truth.” For the first time since its inception, the United States-Mexico-Canada Agreement (USMCA) is facing its mandatory joint review (beginning July 1, 2026), which has transformed the region from a stable trade zone into a theater of intense negotiation and “zombie” uncertainty.
The regional pattern in 2026 is no longer about simple “free trade,” but about building a “Fortress North America” that can operate independently of Asian supply chains.
1. The 2026 USMCA Review: “The Big Squeeze”
The 1990s NAFTA era was about expansion; the 2026 USMCA review is about tightening.
- Contentious Renegotiation: The review is far from procedural. The US is using the “sunset clause” as leverage to demand stricter Rules of Origin, particularly to prevent China from using Mexico as a “backdoor” into the US market.
- The “Zombie” State: Some analysts describe the current status as a “Zombie USMCA”—the agreement technically functions, but long-term investment is being deferred as firms wait to see if the deal will be extended for another 16 years or move to annual, high-friction reviews.
- Digital & Labor Focus: The 2026 talks are heavily focused on Digital Trade (data sovereignty and AI) and the Rapid Response Labor Mechanism, which the US is using frequently to challenge labor practices in Mexican factories.
2. Mexico: The “China+1” Success and Its Limits
In 2026, Mexico remains the #1 trading partner of the United States, but it is hitting a “capacity ceiling.”
- Nearshoring Peak: The “nearshoring” trend that began in 2020 has culminated in a massive industrial corridor in Northern Mexico (Monterrey, Saltillo). In 2024–2025, trade between the US and Mexico hit nearly $930 billion.
- Structural Bottlenecks: Despite the demand, Mexico is struggling with water scarcity, energy reliability, and security issues, which have slowed the pace of new factory openings in early 2026.
- The China Pivot: To comply with US demands, Mexico has begun imposing its own tariffs on Chinese steel and components to preserve its “trusted partner” status within the USMCA.
3. Canada: The Energy & Mineral “Safe Haven”
Canada’s role in the 2026 North American pattern is as the primary provider of Energy Security and Critical Minerals.
- The “Carney Government” Strategy: Canada has shifted its trade focus toward Strategic Autonomy. While 75% of its exports still go to the US, the government is aggressively pursuing “collateral partnerships” with Asia and the Middle East to reduce over-dependence on a volatile US trade policy.
- The “Clean” Edge: Canada is positioning itself as the “green” supplier for the North American EV battery belt, leveraging its vast reserves of ethically sourced lithium, nickel, and copper.
- Effective Tariff Advantage: As of January 2026, Canada maintains the lowest effective tariff rate with the US (around 5-6%), though this is under constant threat from Section 232 “national security” tariffs on steel and aluminum.
4. North American Trade Comparison: 1990s vs. 2026
| Feature | 1990s (NAFTA) | 2026 (USMCA) |
| Logic | “Lowest Cost” Efficiency. | “Highest Security” Resilience. |
| Top Partner | Canada (US #1). | Mexico (US #1). |
| Key Sector | Textiles & Basic Assembly. | AI, EVs, & Advanced Semiconductors. |
| Governance | Set-it-and-forget-it. | Active Review (Sunset Clauses). |
| China’s Role | Future Growth Opportunity. | The “Systemic Rival” to be excluded. |
5. Summary: Regional “Decoupling”
In 2026, North American trade is essentially a re-industrialization project. The region is attempting to “unplug” from global GVCs and plug into a self-contained, high-tech RVC (Regional Value Chain).
How about Latin America?
In 2026, Latin America’s trade pattern is best described as a “Great Resource Realignment.” While the region has traditionally been a “commodity basket,” it is currently transitioning into a strategic battleground for the Global Energy Transition and a secondary hub for Nearshoring.
The pattern is defined by three distinct sub-regions, each playing a different role in the 2026 global economy.
1. The “Lithium Triangle” and Critical Minerals
The Andean region (Chile, Argentina, and Bolivia) has become the “new Middle East” of the 2026 trade world.
- The Lithium Surge: South America is projected to supply over 60% of the world’s lithium from brine sources by the end of 2026.1
- The Direct Lithium Extraction (DLE) Revolution: Trade flows are shifting as companies adopt water-efficient DLE technology.2 This has turned lithium from a “dirty” commodity into a “green-certified” asset, which is essential for entering the European and North American markets.
- Copper Dominance: Chile and Peru remain the world’s copper backbone, providing the physical wiring for the massive expansion of AI data centers and global power grids.3
2. Brazil: The Multi-Bloc Powerhouse
Brazil is the “connector” of the south, balancing its trade between the West and the East.
- China’s Port Strategy: China has invested in over 20 ports across Latin America. The massive Port of Chancay (Peru) and expansions in Santos (Brazil) have created a “Pacific Expressway” for Brazilian soy, iron ore, and corn directly to Asia, bypassing traditional US-led routes.
- Oil Export Boom: Brazil’s offshore “Pre-salt” oil production is hitting new records in 2026 (projected at 5.5 million barrels/day), making it a major energy supplier even as it leads in rare earth oxide production.4
- The EU-Mercosur Pivot: After 25 years of talks, the EU-Mercosur Trade Agreement is in its final ratification stages in 2026. This is opening a massive new “Green Corridor” for South American agriculture to enter Europe in exchange for high-tech machinery.
3. The “New Nearshoring” (Beyond Mexico)
While Mexico is the primary benefactor of USMCA, the “Nearshoring” ripple effect is reaching Central and South America in 2026.5
- The Costa Rica & Colombia Shift: These nations are seeing a surge in US Foreign Direct Investment (FDI) for digital services and medical manufacturing. US firms are moving “back-office” AI and software operations to these regions to match US time zones.
- Guyana’s Oil Miracle: Guyana has become the world’s fastest-growing oil exporter. By February 2026, its exports are expected to reach nearly 1 million barrels per day, completely transforming its trade balance and making it a key player in Atlantic energy security.
4. Latin American Trade Comparison: 1990 vs. 2026
| Feature | 1990s Pattern | 2026 Pattern |
| Top Partner | United States | China (for South); USA (for North/Central). |
| Key Export | Raw Commodities (Oil, Coffee). | Critical Minerals (Lithium, Copper, Rare Earths). |
| Trade Logic | Debt-driven export. | Strategic Autonomy and “Green” premiums. |
| Infrastructure | Dated rail and roads. | Chinese-built deep-water ports. |
| Regional Bloc | Fractured/Slow. | EU-Mercosur (Modernizing) & Pacific Alliance. |
5. Summary: Geopolitical “Ally-shoring”
In 2026, Latin America is no longer just “the backyard” of the United States. It has become a contested prize.
- China is building the infrastructure (ports and 5G).6
- Europe is setting the standards (environmental and sustainability).
- The US is focusing on “Friend-shoring” (moving production out of China and into the Americas).
The region’s biggest risk in 2026 is “Resource Nationalism”—where governments may limit exports of lithium or copper to force companies to build factories locally rather than just shipping raw materials away.
How about Western Europe?
In 2026, Western Europe’s trade model is undergoing a fundamental transformation from “Open Globalization” to “Strategic Autonomy.” The region is no longer prioritizing the lowest-cost imports; instead, it is using its massive market power to enforce environmental standards and reduce “chokepoint” dependencies on systemic rivals.
The 2026 landscape is defined by the “teeth” of new regulations, a major energy pivot, and a struggle to reinvent its most iconic industry: the automobile.
1. The “Green Wall”: CBAM Enters the Definitive Phase1
January 1, 2026, marks a historic milestone in world trade: the Carbon Border Adjustment Mechanism (CBAM) has officially entered its definitive regime.2
- The “Carbon Tax” at the Border: For the first time, importers of steel, aluminum, cement, fertilizers, electricity, and hydrogen must pay a carbon price equivalent to what EU manufacturers pay.
- The Brussels Effect: Europe is effectively “exporting” its climate policy. Trading partners like India and China are now forced to either green their industries or pay a steep premium to access the Western European market.
- The Certification Flow: A new secondary trade has emerged—carbon accounting. Companies are now trading verified emissions data as much as the physical goods themselves.
2. Energy: From Pipelines to Molecules3
Western Europe has successfully “rewired” its energy map. The old East-West pipeline dependence on Russia has been replaced by a West-to-East flow of Liquefied Natural Gas (LNG) and renewables.4
- The Baltic Sea Gateway: The Baltic has become Europe’s new energy center, hosting a dense network of LNG terminals and offshore wind farms that feed the industrial hearts of Germany and Poland.5
- The LNG Surplus: As of 2026, a massive wave of new LNG supply from the US and Qatar is hitting European shores, finally stabilizing energy prices after years of volatility.
- The Hydrogen Struggle: While the EU aims to be a hydrogen superpower, 2026 data shows the transition is slower than planned. “Green” hydrogen remains roughly four times more expensive than natural gas, leading to a “bridge period” where LNG remains the dominant industrial fuel.6
3. De-Risking: The “Small Yard, High Fence” Strategy
Western Europe is moving in lockstep with the US on a “De-risking, not Decoupling” strategy toward China.
- Strategic Sectors: The European Commission has “fenced off” four critical technologies: Semiconductors, AI, Quantum Computing, and Biotech. Trade in these areas is now subject to intense export controls and investment screening.
- Pharmaceutical Sovereignty: After realizing that 90% of certain critical ingredients (APIs) came from China, Western Europe has begun a massive “re-shoring” project to build pharmaceutical manufacturing hubs in France, Ireland, and Germany.
4. The Automotive Identity Crisis
The 1990s were the golden age of the German internal combustion engine. In 2026, the industry is fighting for its life.
- The Market Share Trap: European carmakers have lost nearly 20% of their global market share since 2017. In 2026, Chinese-made EVs account for over 6% of EU sales, despite new protective tariffs.
- High-Cost Reality: European energy costs remain double those of the US and China, making “mass-market” EV production in Western Europe extremely difficult.7
- The Luxury Pivot: To survive, brands like Mercedes-Benz and BMW are pivoting away from volume and toward ultra-high-end luxury, where margins can absorb the higher costs of European labor and green energy.
Western Europe Trade Comparison: 1990 vs. 2026
| Feature | 1990s (Open Integration) | 2026 (Strategic Autonomy) |
| Primary Goal | Single Market Expansion. | Economic Security & Resilience. |
| Energy Source | Piped Russian Gas. | US/Qatari LNG & Offshore Wind. |
| Trade Logic | Efficiency & Consumer Choice. | Carbon Footprint & Geopolitics. |
| Key Partner | USA & Russia. | USA & “Connector” States (India, Vietnam). |
| Regulation | WTO Standards. | CBAM & Digital Product Passports. |
5. Summary: A Mature, High-Value Hub
In 2026, Western Europe is a “mature” trade region. It is no longer growing in volume—retail trade growth is near zero—but it is growing in value and complexity.8 It has become the world’s “Regulatory Superpower,” deciding which products are “clean” enough to enter the world’s most affluent consumer market.9
What about East Asia and the Pacific?
In 2026, the East Asia and Pacific (EAP) region remains the gravitational center of world trade, but it is operating under a “Dual-Track” reality. While it leads the world in AI-driven exports, it is also the primary theater for the most complex trade-war “truces” and geopolitical realignments.
The regional pattern in 2026 is defined by a “resilient rotation”—shifting away from a singular focus on the US market and toward deeper intra-Asian and “Global South” connections.
1. The “Tactical Reset” of 2026
Early 2026 has brought a sigh of relief to the region following a one-year trade truce reached between the US and China in late 2025.1
- The Tariff Truce: The US has implemented a 10-percentage-point reduction in tariffs on Chinese goods in exchange for a “grand bargain” involving Chinese investment in the US.2 This has stabilized the region’s supply chains, though the effective US tariff on China remains high at approximately 30%.3
- Front-Loading Fade: The massive surge in exports seen in 2025 (driven by companies rushing to ship goods before potential tariff hikes) is fading in 2026, leading to a “normalization” of trade volumes.
2. The “AI Hub” Specialization
East Asia has solidified its role as the “Silicon Engine” of the world. In 2026, the region’s growth is bifurcated between high-tech “winners” and traditional manufacturing “laggards.”
- The Tech Outperformers: Taiwan, South Korea, and Singapore are seeing robust growth driven by the “AI Supercycle.”4 Demand for high-bandwidth memory (HBM) and 2nm chips has made these nations indispensable to the global tech economy.
- Japan’s Transformation: Under its first female Prime Minister, Sanae Takaichi, Japan is pursuing a “Security-First” economic model. While Japan-China relations are at a “chilly” historic low due to tensions over Taiwan, Japan is using massive fiscal stimulus to re-shore high-end manufacturing.
3. The “China-South Korea” Pivot5
One of the most surprising shifts in 2026 is the “Restoration” of China-South Korea ties.6
- The Balancing Act: Under President Lee Jae-myung, South Korea has moved to a “neutral” stance, seeking to restore economic cooperation with Beijing after years of pro-Western alignment.7 In early January 2026, the two nations signed 15 major deals covering AI, green industries, and stable rare-earth supplies.8
- Rare Earth Security: South Korea still sources nearly 50% of its rare earth minerals from China, making this “pivot” a matter of industrial survival for its semiconductor sector.9
4. ASEAN: The Diversification Hub
Southeast Asia remains the primary beneficiary of “Supply Chain Diversification” in 2026.10
- Vietnam’s Slowdown: After years of breakneck growth, Vietnam’s export growth is cooling to ~5.9% in 2026 as it hits infrastructure bottlenecks and faces tougher labor regulations.11
- The “India-ASEAN” Corridor: Trade between India and ASEAN is hitting record highs, particularly in food products and pharmaceuticals, as the US rolls back tariffs on over 200 agricultural items, favoring these regions.12
East Asia & Pacific: 1990s vs. 2026
| Feature | 1990s (The “Tigers” Era) | 2026 (The AI & Bloc Era) |
| Growth Engine | Low-cost assembly for the West. | AI Hardware & Digital Services. |
| Top Partner | USA & Japan. | Intra-Regional (China/ASEAN) & USA. |
| Trade Logic | WTO Liberalization. | Economic Security & De-risking. |
| Chokepoint | Labor costs & port capacity. | GPU access & Rare Earth Minerals. |
| China’s Role | Rising “World’s Factory.” | Mature power shifting to Domestic Consumption. |
5. Summary: Navigating “The Vise”
In 2026, the Pacific nations are “innovating to survive.” They are caught in a vise between the US (their security guarantor) and China (their largest customer). The trend for the remainder of 2026 is “Strategic Hedging”—building enough internal strength and regional alliances to ensure that a breakdown in the US-China truce doesn’t collapse their economies.
What about Eastern Europe and the Former Soviet Union?
In 2026, the trade patterns of Eastern Europe and the Former Soviet Union (FSU) have reached a definitive “Geopolitical Bifurcation.” The old model of a unified Eurasian space linked by Russian energy and pipelines has been permanently replaced by two competing corridors: the Western-aligned “European Path” and the East-facing “Asian Pivot.”
Global growth for the region is projected at roughly 2.5% in 2026, but this figure masks the violent decoupling of economies that were once deeply integrated.
1. The Ukraine Reconstruction Economy
In 2026, Ukraine’s trade is no longer just about survival; it is about recovery and integration.
- Growth Rebound: GDP is projected to grow between 2% and 5.2% in 2026, depending on the intensity of hostilities. Trade is increasingly dominated by the import of construction materials, machinery, and energy technology for reconstruction.
- EU Accession Fast-Track: Ukraine, along with Moldova, is deep in technical negotiations for EU membership.1 In 2026, Moldova is already benefitting from “Roam like Home” and other single-market perks, signaling its move away from the FSU sphere.2
- The High-Tech Defense Flow: Ukraine has become a major trade hub for battle-tested defense technology, exporting drone software and electronic warfare systems while importing high-tech components from the West.
2. Russia’s “Asian Life Raft”
By 2026, Russia has completed its “Great Pivot to the East,” having largely severed trade ties with the European Union (which now accounts for only 8% of its exports, down from 50% pre-2022).
- The China-Russia Axis: China is now Russia’s principal trading partner, accounting for roughly 30-35% of its total trade.3 Russia provides discounted oil and gas, while China provides 80–90% of the microchips and high-tech components for Russia’s industrial base.4
- The “Economic Axis” with India: Trade turnover with India has hit record levels (targeted at $100 billion).5 Flows are primarily Russian oil moving south, often settled in national currencies or through complex barter schemes to bypass SWIFT.
- Northern Sea Route: Russia is aggressively marketing the Arctic as a “Suez alternative.”6 By 2026, cargo volumes are scaling toward a 2030 goal of 150 million tons, primarily for energy shipments to Asia.
3. The “Middle Corridor” Renaissance
Central Asia and the Caucasus (Georgia, Azerbaijan, Kazakhstan) are no longer “transit zones”; in 2026, they are the central bridge of Eurasian trade.
- The Trans-Caspian Route: The Middle Corridor (TITR) has seen cargo volumes jump over 60% since the 1990s model collapsed.7 It bypasses Russia entirely, linking China to Europe via the Caspian Sea.8
- Infrastructure Investment: In early 2026, the EU and international partners are deploying an €11 billion ($10.8B) investment package to modernize rail and port capacity along this route.
- Sanctions Circumvention: A major shadow over this region in 2026 is its role in “re-exporting” Western goods into Russia.9 This has led to intense “De-risking” pressure from the EU and US on Central Asian capitals.
4. Regional Trade Comparison: 1990s vs. 2026
| Feature | 1990s (Post-Soviet Chaos) | 2026 (Bifurcated Bloc) |
| Logic | Transition to Market Economy. | Strategic Autonomy / Wartime Economy. |
| Trade Hub | Moscow (CIS center). | Brussels (for West) / Beijing (for East). |
| Key Export | Raw Oil & Gas (to Europe). | Diversified Energy & Defense Tech. |
| Logistics | Northern Corridor (Trans-Siberian). | Middle Corridor (Trans-Caspian). |
| Institutions | CIS / Early WTO. | EU Accession Trio (UA/MD/GE) vs. EAEU. |
5. Summary: A Three-Speed Region
- The Integrationists (Ukraine, Moldova, Western Balkans): Moving rapidly toward the EU Single Market.10
- The Pivoters (Russia, Belarus): Becoming increasingly dependent on Chinese demand and Indian capital.
- The Bridge-Builders (Central Asia, Caucasus): Balancing both sides while trying to build sovereign logistics through the “Middle Corridor.”
Middle Corridor becomes the key route of Eurasian trade
This video highlights the strategic role of Azerbaijan and the Central Asian states in developing the Trans-Caspian International Transport Route as a critical alternative to traditional Russian routes.
How about the Middle East?
In 2026, the Middle East has transitioned from being a “global gas station” to a strategic multi-modal hub. While oil remains the bedrock of fiscal budgets, the region’s trade story is now defined by diversification, digital infrastructure, and a delicate “neutrality” between Eastern and Western power blocs.
The current state can be described through four defining shifts:
1. The “Non-Oil” Engine Takes Over1
For the first time in modern history, the non-oil sector is the primary driver of GDP growth in the Gulf Cooperation Council (GCC).2
- Diversification Milestone: In late 2025 and early 2026, non-oil activities accounted for over 70% of total GDP in some Gulf states.3 The flow of trade is increasingly dominated by tourism, fintech, and logistics rather than just crude.
- The 2026 “Vision” Milestone: This year marks the 10th anniversary of Saudi Arabia’s Vision 2030.4 The kingdom is entering 2026 with high infrastructure spending on “Giga-projects” (like NEOM and the Red Sea Project), which has turned Saudi Arabia into one of the world’s largest importers of specialized construction and green energy technology.
2. IMEC vs. The “Red Sea” Risk
The physical flow of goods through the region is currently a tale of two corridors:5
- The IMEC Blueprint: The India-Middle East-Europe Economic Corridor (IMEC) is the region’s most ambitious trade project in 2026. Designed to cut transit times between India and Europe by 40%, it involves a multi-modal rail and ship route through the UAE, Saudi Arabia, Jordan, and Israel.6
- The Shipping Fragility: Conversely, trade through the Suez Canal and Red Sea remains under pressure.7 Persistent regional conflicts and shipping disruptions (like those seen in late 2024-2025) have forced a “permanent” risk premium on maritime insurance, driving more trade toward overland rail and “air-to-sea” logistics hubs in Dubai and Salalah.
3. The “AI and Data” Trade Flow
In 2026, the Middle East is trading data and compute as aggressively as it once traded barrels.
- Data Center Hubs: The UAE and Saudi Arabia have become global leaders in AI investment.8 Trade flows now include the massive import of GPUs and the “export” of cloud services to the wider MENA (Middle East and North Africa) region.
- Sovereign Wealth as Trade Leverage: Regional sovereign wealth funds (like PIF and ADIA) are no longer passive investors. In 2026, they are using their capital to secure technology transfer agreements, effectively trading investment dollars for the right to manufacture chips and EVs locally.
4. Geopolitical “Multialignment”
The Middle East has successfully avoided choosing sides in the US-China trade war, instead becoming a “bridge.”
- The China Pivot: China remains the region’s largest trading partner. In 2026, we see a surge in “Yuan-denominated” energy deals and Chinese investment in Middle Eastern “Smart Cities.”
- The US Security Link: While China is the top customer, the US remains the primary partner for defense, aerospace, and high-end AI research, creating a balanced, “transactional” trade model.
Middle East Trade: 1990s vs. 2026
| Feature | 1990s Pattern | 2026 Pattern |
| Primary Export | Crude Oil. | Energy + Services + Data. |
| Key Corridor | Suez Canal (Maritime). | IMEC (Rail/Maritime) & Air Hubs. |
| Growth Driver | Global Energy Demand. | Internal “Vision” Diversification. |
| Currency | 100% Petrodollar. | Dollar-pegged but Multi-currency ready. |
| Logistics Hub | Emerging (Jebel Ali). | Global Super-nodes (Dubai, Riyadh, Doha). |
5. Summary: A Fragmented Recovery
While the Gulf states (UAE, Qatar, Saudi Arabia) are seeing robust growth of 4.5% in 2026, the wider region remains “uneven.” Nations like Egypt and Jordan are grappling with high debt and the ripple effects of regional instability, creating a “two-speed” Middle East where wealth and stability are concentrated in the energy-exporting “Vision” economies.
Can these same concept be applied to the internet?
Absolutely. The same paradigm shift—from Hyper-Efficiency to Resilience and Sovereignty—is fundamentally reshaping the internet in 2026.
If the 1990s internet was about “Globalism and Open Borders,” the 2026 internet is about “The Splinternet and Data Sovereignty.”
1. The Paradigm Shift: From “Global Web” to “Splinternet”
The core logic of the internet has flipped. We are moving away from a single, frictionless network of networks toward a fragmented landscape defined by geopolitical borders.1
| Feature | The 1990s Internet (Efficiency) | The 2026 Internet (Resilience/Sovereignty) |
| Primary Goal | Connecting everyone to everything. | Securing national data and AI models. |
| Data Flow | Frictionless, global. | Regulated by Data Sovereignty laws. |
| Logic | The “Global Village.” | The “Splinternet” (Regional Blocs). |
| Key Metric | User Growth & Bandwidth. | Compute Power & Model Sovereignty. |
2. “Digital Friend-Shoring” and Data Sovereignty
Just as physical goods are being “friend-shored,” digital activity is now being “walled off” to ensure security.
- Data Residency: In 2026, nations like Canada, India, and the EU have implemented strict rules requiring that data about their citizens be stored and processed within their own borders.2
- Sovereign Clouds: Governments are no longer comfortable hosting their critical infrastructure on generic global clouds. We are seeing the rise of Sovereign Cloud solutions—isolated, high-security data centers that are legally and physically insulated from foreign court orders (like the US CLOUD Act).3
3. The “AI Supercycle” and Compute Realignment
In the 1990s, the “trade” was in HTML pages and emails. In 2026, the primary trade flow is in Inference and Training Data.
- Compute-Rich vs. Compute-Poor: A new digital divide has emerged. Nations with the energy grids and GPU clusters to host Large Language Models (LLMs) are the new “digital exporters,” while those without them must “import” intelligence, creating a new form of digital dependency.
- Agentic Trade: AI agents now account for a massive share of internet traffic. These bots don’t just “crawl” the web; they make autonomous purchasing and logistics decisions, rerouting “digital supply chains” in real-time based on local regulations.
4. Regulation as a Trade Barrier (The “Brussels Effect”)
Just as CBAM (Carbon Tax) is a barrier for steel, regulations like GDPR and the EU AI Act act as high fences for the internet in 2026.
- Technical Fragmentation: To comply with regional laws, global platforms (Meta, Google, ByteDance) now offer vastly different versions of their services in different regions.
- The “Small Yard, High Fence”: The US and EU have increasingly “fenced off” sensitive digital sectors (Quantum, Biotech, Advanced Chips) from China-led digital spheres, creating two parallel tech ecosystems that barely communicate.
5. Summary: 1990s vs. 2026 Internet Flows
- 1990s: The internet was a commodity.4 It was a “public good” that everyone shared, mostly built on US standards and open protocols.
- 2026: The internet is infrastructure. It is a contested strategic asset. We have moved from a “Network of Networks” to a “Network of Fortresses.”
Is artificial intelligence shifting the dominant players world trade patterns?
In 2026, Artificial Intelligence (AI) has moved beyond being a “tech tool” to becoming the primary engine of National Competitive Advantage. It is not just shifting who trades what; it is rewriting the hierarchy of global power.1
The shift can be categorized into three “AI Trade Frontiers”:
1. The “Compute Sovereign” vs. “Compute Importers”
The most significant shift in 2026 is the emergence of a new “Resource Class.” In the 1990s, trade power was based on oil or manufacturing capacity. In 2026, it is based on Compute Capacity (FLOPs).
- The AI Superpowers (Tier 1): The United States and China are the dominant “exporters of intelligence.” The US leads in high-end model weights and private investment ($109B+), while China leads in the sheer volume of AI research and industrial application.2
- The Sovereign Cloud Shift: Nations like Saudi Arabia (with its $100B “Project Transcendence”) and the UAE are refusing to be “mere importers.”3 They are building their own “Sovereign AI” to ensure their national data and cultural values aren’t processed on foreign-controlled servers.
- The Malaysia & India “Data Center Boom”: These countries are emerging as the “New Detroits” of the digital age. Malaysia is on track to be the world’s third-largest data center hub by late 2026, acting as a neutral “processing floor” for both Western and Eastern tech firms.4
2. AI as a “Trade Friction” Reducer
While geopolitics creates tariffs, AI is working in the background to lower the “invisible” costs of trade.
- Predictive Logistics: In 2026, leading importers have integrated AI to reduce inventory levels by 20%.5 AI now predicts port congestion weeks in advance, allowing ships to reroute before a bottleneck even forms.6
- Automated Compliance: The 2026 trade standard is AI-driven customs. Manual HS code classification is becoming obsolete; AI models now cross-check documentation in milliseconds, significantly speeding up clearances for “trusted” AI-integrated shippers.7
3. The “Productivity Wildcard”
AI is creating a “productivity gap” that is reshaping trade balances:
- The US Advantage: AI infrastructure spending now accounts for roughly 1% of US GDP growth.8 This “AI-cushion” is helping the US economy remain resilient even amidst high interest rates and trade tensions with China.9
- The “Laggard” Risk: There is a growing concern for Western Europe and the Global South. Countries that fail to invest in AI infrastructure by 2026 are seeing their service sectors (legal, accounting, coding) “imported” from compute-rich nations, leading to a new kind of “digital trade deficit.”
AI Trade Pattern Comparison: 1990s vs. 2026
| Feature | 1990s Trade | 2026 AI-Driven Trade |
| Core Asset | Labor & Fossil Fuels | Compute & Proprietary Data |
| Trade Bottleneck | Shipping & Physical Ports | Power Grids & Chip Access |
| Growth Driver | WTO Liberalization | Sovereign AI & “Friend-Shoring” |
| Key Export | Finished Consumer Goods | Trained Models & Agentic Services |
4. Summary: The “Power” Paradox
In 2026, Power has a double meaning.
- Geopolitical Power: The ability to control the flow of AI chips and data.
- Electrical Power: The physical ability to fuel the data centers.10In 2026, countries with stable, cheap electricity (like Canada or the Nordics) are becoming the “safe havens” for the world’s compute-heavy trade, as power scarcity becomes the ultimate limit on AI expansion.
Solved Problems
Category 1: Geopolitics & The “Splinternet”
1. The Transshipment Puzzle
- Problem: A US-based manufacturer suspects that “Made in Vietnam” components are actually Chinese goods rerouted to bypass 2026 tariffs. How can they verify this without halting production?
- Solution: Implement AI-driven origin tracing using satellite imagery of factory activity and “Digital Twins” of supply chains to cross-reference reported production capacity with energy consumption at the source.
2. The USMCA “Sunset” Hedge
- Problem: With the 2026 USMCA review looming, a Canadian firm is hesitant to invest in a new facility. What strategic trade mechanism can protect their capital?
- Solution: Utilize “Contingent Investment Clauses” and government-backed “Tariff Insurance” programs that trigger compensation if the trade agreement is not renewed or if rules of origin are drastically tightened.
3. Data Residency vs. AI Training
- Problem: A global bank wants to train a unified AI model but faces conflicting “Data Sovereignty” laws in the EU (GDPR) and India (DPDP).
- Solution: Deploy Federated Learning, where the AI model is trained on local servers in each region. Only the “learned weights” (mathematical patterns), not the raw citizen data, are exported to the central hub.
Category 2: AI & Predictive Logistics
4. The “Ghost Demand” Crisis
- Problem: In 2025, retailers “front-loaded” inventory to beat 2026 tariffs, leading to a massive “bullwhip effect” surplus. How do they rebalance in 2026?
- Solution: Use Agentic AI to autonomously negotiate “flash-sales” to secondary markets in Southeast Asia and South America, liquidating surplus while using predictive analytics to ensure 2027 restocking matches actual consumption, not tariff-avoidance spikes.
5. Real-Time Port Congestion
- Problem: A shipment of perishable vaccines is headed to a port experiencing a sudden labor strike.
- Solution: An AI Logistics Orchestrator detects the strike via real-time social sentiment and port data 48 hours before arrival, automatically rerouting the vessel to a “Tier 2” port and pre-booking refrigerated truck capacity for the final mile.
6. AI-Driven Customs Compliance
- Problem: A tech firm is importing thousands of unique server components for a new AI data center, each with different HS (Harmonized System) codes.
- Solution: Apply NLP (Natural Language Processing) models to scan technical blueprints and automatically assign the correct HS codes, reducing the risk of 2026 “Customs Fraud” task force audits and avoiding 15% misclassification penalties.
Category 3: The “Green” Economy & CBAM
7. The “Green Steel” Premium
- Problem: A European carmaker must meet the 2026 CBAM (Carbon Tax) requirements but finds “Green Steel” (Hydrogen-based) is 30% more expensive than Chinese coal-based steel.
- Solution: Re-engineer the vehicle to use a “Material Mix” strategy, using high-strength green steel only for structural safety cages while using recycled secondary aluminum for body panels, balancing the total carbon “border fee” with manufacturing costs.
8. Scope 3 Emissions Transparency
- Problem: A retail giant needs to report its “Scope 3” (supply chain) carbon footprint to comply with 2026 SEC disclosure rules.
- Solution: Integrate Blockchain-based Tier-N tracking, where every supplier in the chain uploads their energy bill data. AI then verifies the authenticity of these “Green Certificates” to prevent “Carbon Laundering.”
9. The Data Center “Water Thirst” Conflict
- Problem: A tech firm’s new AI data center in a drought-prone region is facing local protests over its 2-million-liter-per-day water usage.
- Solution: Transition to “Liquid-to-Chip” cooling using closed-loop recycled wastewater and implement “Carbon/Water Scheduling”—processing heavy AI training tasks during cooler night hours or in regions with surplus renewable energy.
Category 4: Resource Nationalism & Emerging Markets
10. The Lithium Export Ban
- Problem: A nation in the “Lithium Triangle” suddenly bans the export of raw ore, requiring all lithium to be processed into battery-grade chemicals locally.
- Solution: Establish a Joint Venture (JV) Refinery with a local state-owned firm. The foreign company provides the DLE (Direct Lithium Extraction) technology in exchange for a guaranteed 10-year supply of the processed chemical.
11. The “Middle Corridor” Risk
- Problem: A shipper wants to use the Trans-Caspian “Middle Corridor” to bypass Russia, but the route involves multiple border crossings and ferry transfers.
- Solution: Utilize “Unified Digital Waybills” (e-CMR) integrated with IoT sensors on containers. This creates a “single window” for customs, reducing the “border-friction” cost by an estimated 12% in 2026.
12. Currency Volatility in the Global South
- Problem: A manufacturer in Brazil is struggling with a volatile Real when buying US-made AI chips.
- Solution: Negotiate “Central Bank Swap” backed contracts or use stablecoins for B2B settlements, fixing the exchange rate at the time of the purchase order rather than at the time of delivery.
Category 5: Labor & The New Workforce
13. The “Retiring Expert” Knowledge Gap
- Problem: A German precision-engineering firm is losing 20% of its workforce to retirement in 2026.
- Solution: Use Generative AI “Knowledge Capture”—recording master technicians at work and using AI to turn those videos into interactive AR (Augmented Reality) training modules for new apprentices.
14. Labor Rights in “Friend-Shoring” Hubs
- Problem: A brand moving production from China to Vietnam is accused of using forced labor in its new supply chain.
- Solution: Deploy “Worker-Voice” AI platforms—anonymous mobile apps where workers report conditions directly to the brand’s headquarters, bypassing local factory management and satisfying 2026 ESG audit requirements.
15. AI-Assisted “Nearshoring” Feasibility
- Problem: A US firm is deciding between Mexico and Colombia for a new electronics plant.
- Solution: Run a Multi-Variable Monte Carlo Simulation using AI to weigh labor costs, energy grid stability (2026 projections), and proximity to US “Battery Belt” hubs, determining that Mexico has a higher 5-year ROI despite 10% higher labor costs.
Category 6: Financial & Market Dynamics
16. The AI “Winner-Takes-All” Portfolio
- Problem: An investor’s portfolio is split between “AI leaders” (growing 15%) and “Legacy firms” (flat). How do they hedge against an AI market bubble in 2026?
- Solution: Adopt a “Barbell Strategy”—overweighting AI infrastructure (utilities/chips) while holding “defensive” non-cyclical commodities (gold/wheat) that historically resist tech-sector corrections.
17. “Agentic” Price Wars
- Problem: A company’s automated pricing AI is caught in a “downward spiral” with a competitor’s AI, destroying profit margins.
- Solution: Implement “Circuit-Breaker Algorithms” that prevent the AI from dropping prices below a “Sustainability Floor” (calculated using real-time raw material and shipping costs) even if the competitor continues to drop.