
Meteorology Today Second Canadian Edition
Earth and Atmospheric Sciences
Defining Global Climate
While weather refers to the short-term conditions of the atmosphere (what’s happening outside your window right now), global climate is the long-term average of those conditions across the entire planet.
To determine the global climate, scientists look at decades of data—typically 30 years or more—to identify patterns in temperature, humidity, atmospheric pressure, wind, and precipitation. It is essentially the “big picture” of Earth’s energy balance.
The Planetary Energy Balance
At its core, global climate is governed by how much energy the Earth receives from the sun versus how much it sends back into space. This involves several moving parts:
- Solar Radiation: The primary energy source for our climate system.
- The Greenhouse Effect: Naturally occurring gases in the atmosphere (like water vapor, carbon dioxide, and methane) trap some of the sun’s heat. Without this effect, Earth would be too cold to support life as we know it.
- Albedo: This is the reflectivity of the Earth’s surface. Bright surfaces like Arctic ice reflect energy back into space, while dark surfaces like the deep ocean absorb it.
Key Components of the Climate System
Global climate isn’t just about the air; it is a result of the interaction between five major systems:
- Atmosphere: The layers of gases surrounding the planet.
- Hydrosphere: All of Earth’s liquid water, including oceans, lakes, and rivers.
- Cryosphere: The frozen parts of the Earth, such as glaciers, ice sheets, and permafrost.
- Lithosphere: The Earth’s crust and land surface, which affects wind patterns and absorbs heat.
- Biosphere: All living organisms, which exchange gases (like CO2 and O2) with the atmosphere.
Why Global Climate Matters
A small change in the global average temperature can lead to massive shifts in local environments. Because the system is interconnected, a warming global climate can alter the thermohaline circulation (the “Great Ocean Conveyor Belt”), change the path of jet streams, and increase the frequency of extreme weather events.
Understanding these patterns requires complex mathematical modeling, often involving fluid dynamics and calculus to predict how energy moves through the atmosphere and oceans.
What are climate controls?
Climate controls are the physical factors that determine the climate of a specific location. While the global climate is an average of the entire planet’s energy, local and regional climates are shaped by these “controls” that distribute heat and moisture unevenly across the Earth’s surface.
The primary climate controls include:
1. Latitude (Intensity of Sunlight)
This is the most significant control. Because the Earth is a sphere, the sun’s rays hit the Equator directly (90° angle) but strike the poles at a shallow angle.
- Low Latitudes: Receive concentrated solar radiation year-round, leading to warmer climates.
- High Latitudes: Energy is spread over a larger area, and the atmosphere filters more of it out, leading to colder climates.
2. Land and Water Distribution
Land heats up and cools down much faster than water. This creates a major distinction in climate types:
- Continental Climates: Areas far from oceans experience extreme temperature swings between summer and winter.
- Maritime Climates: Coastal areas stay more temperate because the ocean acts as a heat sink, absorbing heat in the summer and releasing it slowly in the winter.
3. Ocean Currents
Oceans act as a global conveyor belt, moving warm water from the Equator toward the poles and cold water back toward the Equator.
- Warm Currents: (e.g., the Gulf Stream) can make high-latitude regions much warmer than they would be otherwise.
- Cold Currents: (e.g., the California Current) can stabilize the atmosphere and lead to cooler, drier coastal conditions.
4. Elevation (Altitude)
In the lower atmosphere (the troposphere), temperature generally decreases as altitude increases. This is why you can find snow-capped mountains even in tropical regions. On average, the temperature drops about 6.5°C for every 1,000 meters of elevation gain.
5. Topography (Mountain Barriers)
Mountains act as physical barriers to air movement, creating the Rain Shadow Effect:
- Windward Side: Air is forced upward, cools, and drops its moisture as rain or snow.
- Leeward Side: The air descends and warms up, becoming very dry and creating desert-like conditions.
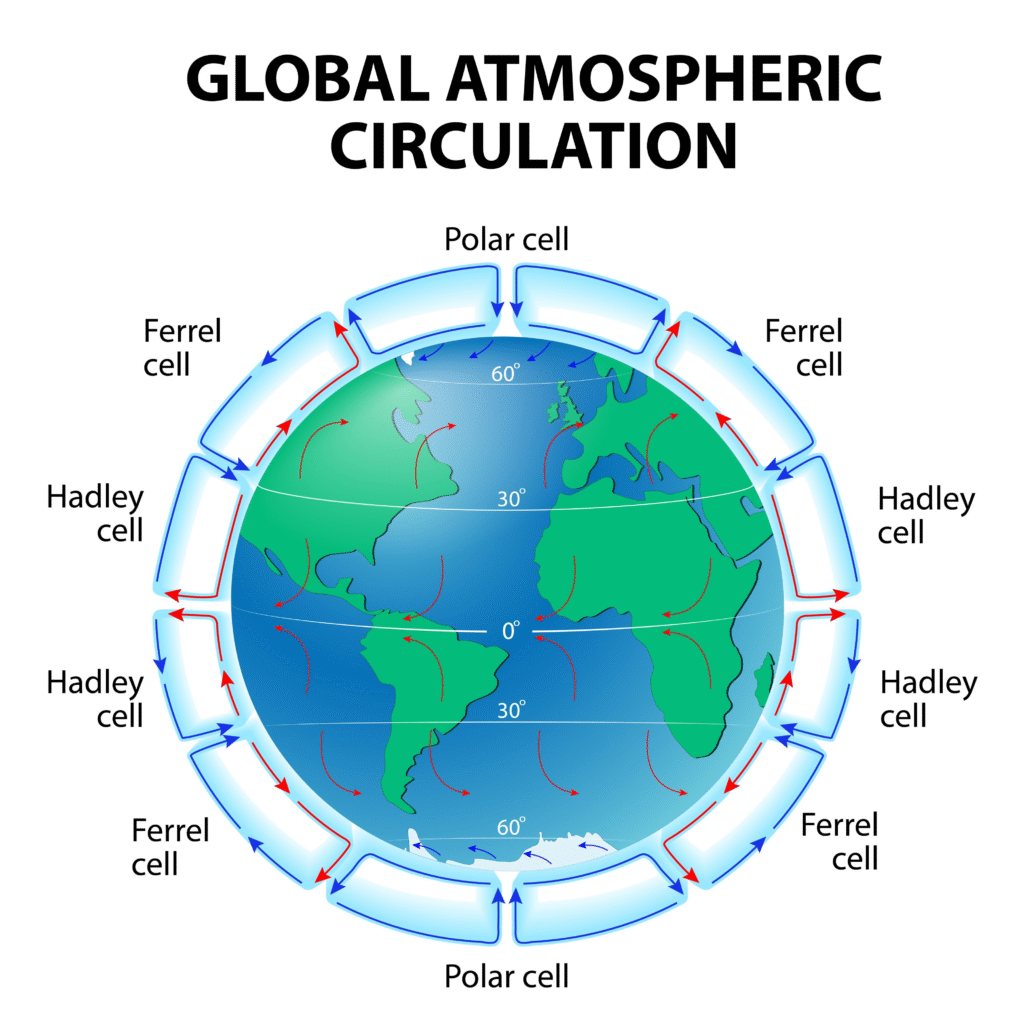
6. Prevailing Winds and Pressure Cells
The global circulation of air—driven by large-scale pressure belts like the Hadley Cell—determines where moisture is carried.
- High Pressure: Usually results in dry, clear skies (where most of the world’s deserts are found).
- Low Pressure: Leads to rising air, clouds, and heavy precipitation.
7. Albedo (Surface Reflectivity)
The nature of the ground surface controls how much energy is absorbed. Fresh snow has a high albedo (reflecting up to 90% of sunlight), while dark forests or asphalt have a low albedo, absorbing more heat and warming the surrounding air.
What are global temperatures?
Global temperature is a measure of the average heat energy across the entire surface of the Earth. Unlike a local thermometer reading, which tells you how warm it is in one spot, the global temperature is a calculated average that accounts for every square kilometer of land and ocean.
Because the Earth is a complex system with varying elevations and environments, scientists typically measure temperature anomalies—how much warmer or colder a specific area is compared to a long-term historical average (the “baseline”)—rather than just the raw degrees.
How Global Temperatures are Calculated
Calculating a single number for the entire planet requires integrating data from thousands of sources:
- Weather Stations: Ground-based sensors that record air temperature about 1.5 to 2 meters above the surface.
- Sea Surface Temperatures (SST): Data collected from ships, drifting buoys, and specialized satellites to measure the top layer of the ocean.
- Satellite Radiance: Instruments like the Advanced Microwave Sounding Unit (AMSU) measure the thermal radiation emitted by oxygen molecules in the atmosphere to estimate temperatures at different altitudes.
- Interpolation: Since there aren’t weather stations in the middle of every desert or ice sheet, mathematical models use surrounding data to “fill in the gaps” for remote regions.
The Role of Heat Capacity
The global temperature is heavily influenced by the oceans. Water has a much higher specific heat capacity than land, meaning it takes significantly more energy to raise the temperature of the ocean by $1^\circ C$ than it does to warm the continents.
Consequently, the oceans act as a massive heat reservoir, absorbing over 90% of the excess energy trapped in the climate system.
Vertical Temperature Profiles
Global temperatures aren’t uniform as you move upward. In the Troposphere (the lowest layer), temperatures generally decrease with height. However, in the Stratosphere above it, temperatures can actually increase with altitude due to the absorption of UV radiation by the ozone layer.
Scientists monitor these different layers to understand how energy is moving through the entire “atmospheric column.”
Global Temperature Drivers
Several natural and human-induced factors cause these temperatures to fluctuate:
| Factor | Mechanism |
| Greenhouse Gases | Trace gases like CO2, CH4, and N2O trap longwave infrared radiation. |
| Aerosols | Volcanic ash or industrial soot can reflect sunlight, occasionally causing temporary global cooling. |
| El Niño / La Niña | Periodic shifts in Pacific Ocean temperatures that redistribute heat globally. |
| Solar Cycles | Minor fluctuations in the sun’s total energy output over roughly 11-year cycles. |
A Note on Equilibrium: The global temperature is essentially the result of the Earth’s Energy Balance. If the energy coming in from the sun equals the energy radiated back into space, the temperature remains stable. If that balance is disrupted, the global average shifts.
What are precipitation extremes?
Defining Precipitation Extremes
Precipitation extremes refer to weather events that fall at the very high or very low ends of the historical distribution for a specific location. In meteorology, these are often defined as events that exceed the 90th, 95th, or 99th percentile of recorded precipitation data.
Because the atmosphere behaves as a fluid system, these extremes are driven by changes in thermodynamics (temperature and energy) and dynamics (the movement of air and moisture).
The Two Sides of the Extreme
Precipitation extremes are generally categorized into two opposing phenomena:
1. Extreme Heavy Precipitation (Deluges)
This occurs when an unusually large amount of rain or snow falls in a short period. This is governed largely by the Clausius-Clapeyron relationship, a principle in thermodynamics which states that for every 1°C of warming, the atmosphere can hold approximately 7% more water vapor.
- Atmospheric Rivers: Long, narrow corridors in the atmosphere that transport massive amounts of water vapor from the tropics to higher latitudes. When these “rivers in the sky” hit land, they can trigger extreme flooding.
- Convective Extremes: Intense, localized thunderstorms where rapid vertical motion (updrafts) processes vast amounts of moisture quickly.
2. Extreme Deficits (Meteorological Drought)
At the other end of the spectrum, precipitation extremes include prolonged periods with little to no measurable precipitation.
- Blocking Highs: Large-scale high-pressure systems that “stall” over a region, pushing moisture-bearing storms away and leading to “flash droughts”—rapid-onset drying that can deplete soil moisture in weeks.
- Subsidence: In certain parts of the global circulation, air is constantly sinking; as it sinks, it warms and dries out, preventing clouds from forming.
Key Drivers of Precipitation Extremes
Several factors determine when a normal rain event becomes an “extreme” one:
- Latent Heat Release: As water vapor condenses into rain, it releases energy (latent heat). This heat fuels the storm, making the updrafts stronger and allowing the storm to “suck in” even more moisture from the surrounding area.
- Convergence Zones: Areas where winds from different directions collide, forcing air upward. If the air is highly saturated, this mechanical lifting triggers massive precipitation.
- Topographic Lifting: When moisture-rich air is forced over mountain ranges, the rapid ascent causes “orographic extremes,” where one side of a mountain receives several times its monthly average rainfall in a single day.
Impact on the Hydrological Cycle
Precipitation extremes disrupt the balance of the hydrological cycle. Instead of water soaking into the ground (infiltration), extreme downpours often lead to high surface runoff, causing flash floods and erosion. Conversely, extreme deficits lower the water table and reduce the discharge of rivers, affecting both ecosystems and human infrastructure.
In many regions, we see a “intensification” of the cycle: the wet periods get wetter and the dry periods get drier, even if the total annual precipitation remains roughly the same.
What is global precipitation?
Global precipitation is the total amount of water—in liquid or solid form—that falls from the atmosphere to the Earth’s surface across the entire globe. This includes rain, snow, sleet, and hail.
On a planetary scale, precipitation is a massive cooling mechanism for the atmosphere and a heating mechanism for the surface, driven by the Global Hydrological Cycle.
The Global Water Balance
The Earth acts as a closed system for water. Over a long enough timeline (usually a year), the total amount of global evaporation must roughly equal the total amount of global precipitation.
- Evaporation: Solar radiation heats the ocean and land, turning liquid water into water vapor.
- Latent Heat: As water evaporates, it absorbs energy. This “latent heat” is stored in the vapor and transported by winds.
- Condensation & Precipitation: When the air cools or rises, the vapor condenses back into liquid or ice, releasing that stored energy back into the atmosphere and falling as precipitation.
Spatial Distribution: Where it Rains (and Where it Doesn’t)
Global precipitation is not spread evenly. It is dictated by the Earth’s Atmospheric Circulation Cells:
- The ITCZ (Intertropical Convergence Zone): Located near the Equator, this is a permanent band of low pressure where warm, moist air rises rapidly. This creates the world’s heaviest rainfall zones and tropical rainforests.
- Subtropical Highs: Around 30° North and South latitude, air that rose at the equator sinks. Sinking air warms and dries out, creating “dry belts” where most of the world’s major deserts (like the Sahara) are located.
- Mid-Latitude Storm Tracks: Between 40° and 60° latitude, the meeting of cold polar air and warm subtropical air creates frontal systems that bring consistent rain and snow to regions like Western Europe and the Pacific Northwest.
Measuring Precipitation Globally
Because 70% of the Earth is covered by water, ground-based rain gauges aren’t enough to track global totals. Scientists rely on a combination of technologies:
- GPM (Global Precipitation Measurement): A network of satellites that use radar and microwave imagers to “see” through clouds and measure the size and intensity of raindrops and snowflakes from space.
- TRMM (Tropical Rainfall Measuring Mission): A legacy satellite program that specifically focused on the heavy rainfall in the tropics, which drives much of the world’s weather energy.
- Reanalysis Models: Meteorologists use fluid dynamics equations to combine satellite data with ground observations, creating a consistent “map” of global water movement.
The “Intensification” of Precipitation
As the global temperature increases, the “speed” of the global precipitation cycle tends to increase as well. A warmer atmosphere can hold more moisture (the Clausius-Clapeyron relationship), which often leads to a shift in how precipitation is delivered:
- Increased Frequency of heavy downpours in wet regions.
- Extended Duration of dry spells in arid regions.
Essentially, the “rich get richer and the poor get poorer” when it comes to global water distribution.
What is climatic classification?
Climatic classification is the process of grouping the Earth’s diverse local climates into distinct categories based on shared characteristics. Because climate is a continuous spectrum, these systems use mathematical thresholds—typically specific ranges of temperature and precipitation—to draw boundaries between different regions.
There are two primary ways scientists approach this: Genetic classification (based on what causes the climate, like air masses) and Empirical classification (based on observable data, like statistics and vegetation).
The Köppen Climate Classification System
The most widely used empirical system is the Köppen Climate Classification, developed by Wladimir Köppen. It assumes that native vegetation is the best expression of climate, so it uses temperature and precipitation limits to define five major groups:
| Group | Type | Primary Characteristics |
| A | Tropical | High temperatures year-round; average of every month is 18°C or higher. |
| B | Dry | Potential evaporation exceeds precipitation; includes deserts and steppes. |
| C | Temperate | Mild winters; the coldest month is between -3°C and 18°C. |
| D | Continental | Severe winters; at least one month averages below -3°C and one month above 10°. |
| E | Polar | Extremely cold; every month of the year averages below 10°. |
How Systems are Built (Sub-categories)
Most systems use a “letter code” to provide more detail. For example, in the Köppen system:
- The Second Letter usually refers to precipitation timing (e.g., f for wet year-round, s for dry summer, w for dry winter).
- The Third Letter refers to temperature intensity (e.g., a for hot summers, b for warm summers, k for cold).
Example: A “Cfb” climate (like much of Western Europe) is a Temperate (C), fully humid (f), with a warm summer (b).
Other Common Classification Systems
1. The Thornthwaite System
Unlike Köppen, which focuses on vegetation, the Thornthwaite system focuses on the water balance. It uses a “Moisture Index” based on potential evapotranspiration—the amount of water that would evaporate if it were available—compared to actual precipitation. This is highly useful for hydrology and agriculture.
2. Genetic Classifications
These systems look at the origin of the climate. They categorize regions based on:
- Air Mass Source Regions: Whether the air is maritime (moist) or continental (dry).
- Frontal Zones: Where major weather systems like the Polar Front typically sit.
- Solar Radiation: The net energy balance at different latitudes.
Why Classification Matters
Categorizing climates allows researchers to:
- Predict Ecosystems: Determine which crops or wildlife can survive in a specific region.
- Track Climate Shift: Observe if a region’s classification changes over decades (e.g., a “Temperate” zone shifting into a “Dry” zone).
- Urban Planning: Design infrastructure and buildings that are optimized for specific thermal and moisture conditions.
What is the Koppen system?
The Köppen Climate Classification System is the most widely used method for mapping the world’s diverse climates. Developed by German-Russian climatologist Wladimir Köppen around 1900 (and updated frequently since), it is an empirical system, meaning it uses observable data—specifically monthly temperature and precipitation—to define climate boundaries.
The system is unique because it uses native vegetation as a natural indicator of climate. Köppen recognized that plants are the best “weather gauges” for long-term conditions.
The Five Major Groups
The system organizes the world into five primary groups, represented by the capital letters A, B, C, D, and E.
| Letter | Climate Group | Key Identifying Criteria |
| A | Tropical | Every month has an average temperature of 18°C or higher. No winter season. |
| B | Dry | Evaporation exceeds precipitation. Boundaries are defined by a specific mathematical formula. |
| C | Temperate | Coldest month is between -3°C and 18°C; at least one month is above 10°C. |
| D | Continental | Coldest month is -3°C or colder; at least one month is above 10°C. |
| E | Polar | Every month of the year has an average temperature below 10°C. |
The Three-Letter Code
To provide more detail, the Köppen system uses a string of two or three letters. Each letter adds a layer of precision regarding moisture and heat intensity.
1. The Second Letter (Precipitation)
This letter indicates when the rain (or snow) falls during the year:
- f: Wet year-round (feucht – moist)
- w: Dry winter (wintertrocken)
- s: Dry summer (sommertrocken)
- m: Monsoon (specific to Group A)
- W/S: Desert (Wüste) or Steppe (Steppe) (specific to Group B)
2. The Third Letter (Temperature Intensity)
This describes the heat of the summers or the severity of the winters:
- a: Hot summer (hottest month > 22°C)
- b: Warm summer (hottest month < 22°C, but at least four months > 10°C)
- c: Cool summer (fewer than four months > 10°C)
- d: Extremely cold winter (coldest month < -38°C)
- h/k: Hot (h) or Cold (k) (specific to Group B)
Why it is Scientifically Valuable
The Köppen system is highly valued in fields like ecology, hydrology, and agriculture because it creates a standard language for describing environments. For example, a Cfb climate in Western Europe shares nearly identical environmental constraints with a Cfb climate in parts of New Zealand or the Pacific Northwest.
Example Classification:
- Af: Tropical Rainforest (Hot and wet all year)
- BWh: Hot Low-Latitude Desert (e.g., the Sahara)
- Dfc: Subarctic Climate (Long, cold winters and short, cool summers)
The Mathematical Thresholds
Unlike purely descriptive systems, the Köppen system relies on specific formulas to draw its lines. For instance, the boundary between a “Dry” (B) and “Humid” (A, C, D) climate isn’t just a single rain total; it depends on when the rain falls.
If most rain falls in the summer (when evaporation is high), a region needs more total annual precipitation to avoid being classified as a desert than if the rain falls in the winter.
What is Thornwaite’s system?
While the Köppen system focuses on vegetation and temperature, the Thornthwaite system (introduced by American climatologist C.W. Thornthwaite in 1948) is a water-balance approach to classification.
It is designed to determine how much water is actually available for plants by comparing precipitation to the amount of water lost through evaporation and transpiration. This makes it a critical tool for hydrology, soil science, and agriculture.
The Core Concept: Potential Evapotranspiration (PET)
The defining feature of Thornthwaite’s system is Potential Evapotranspiration (PET).
- Definition: PET is the amount of water that would evaporate from the soil and transpire from plants if there were an unlimited supply of water available in the ground.
- The Logic: If actual precipitation ($P$) is greater than PET, you have a water surplus. If PET is greater than P, you have a water deficit.
Thornthwaite developed a mathematical formula to calculate PET based primarily on mean monthly temperature and the length of daylight (which varies by latitude).
The Four Indices of Classification
Thornthwaite’s system uses four specific indices to categorize a climate. Instead of just “Hot” or “Cold,” it looks at the efficiency of the water cycle:
1. The Moisture Index (Im)
This is the most important index. It determines whether a climate is moist or dry by comparing the annual water surplus (s) and water deficit (d) to the PET.
- Humid Climates: Im > 0 (Surplus water is available for streams and groundwater).
- Arid Climates: Im < 0 (The environment is water-stressed).
2. Thermal Efficiency (T-E Index)
This represents the total PET for the year. Since PET is driven by heat, this index effectively measures the “thermal energy” available to drive the water cycle. It classifies regions from Megathermal (high energy/tropical) to Tundra and Frost (low energy).
3. Seasonal Distribution of Water Adequacy
This index tracks when the water surplus or deficit occurs. A region might have a high annual rainfall, but if it all falls in two months, the “adequacy” of that water for agriculture is different than if it were spread out year-round.
4. Summer Concentration of Thermal Efficiency
This measures how much of the year’s total PET occurs during the three summer months. In high-latitude regions, almost all “climate work” (evaporation and growth) happens in a short summer burst, whereas in the tropics, it is spread evenly.
Why use Thornthwaite instead of Köppen?
| Feature | Köppen System | Thornthwaite System |
| Primary Basis | Vegetation boundaries | Water balance & PET |
| Data Needed | Temperature & Precipitation | Temp, Precip, & Day length |
| Best Use Case | Global climate mapping | Irrigation & Crop planning |
| Perspective | Descriptive (What is there?) | Functional (How does it work?) |
Application in Hydrology
Because Thornthwaite’s system tracks the soil moisture storage, it allows scientists to predict exactly when a drought will begin to impact crop yields or when a river’s flow will likely peak. It treats the climate like a “bank account”: precipitation is a deposit, and evapotranspiration is a withdrawal.
What are climatic regions in Canada?
Canada is the second-largest country in the world, covering nearly 40° of latitude. Because of its massive size, its climatic regions are shaped by a tug-of-war between cold Arctic air, moist Pacific air, and the varying heat capacities of its landmass and oceans.
While classification systems like Köppen can get very granular, Canada is generally divided into seven distinct climatic regions:
1. The Arctic Region
This region includes the Far North and the Arctic Archipelago. It is characterized by extremely long, cold winters and short, cool summers.
- Climate Control: High latitude. The sun stays below the horizon for parts of the winter, and even in summer, the low sun angle provides little heating.
- Precipitation: Very low. It is often called a “polar desert” because the cold air cannot hold much moisture.
2. The Taiga (Subarctic) Region
Stretching from Alaska to Labrador, this is a vast belt of coniferous forest.
- Characteristics: It experiences some of the widest temperature ranges on Earth. Winters are bitter, but summers are warm enough to support tree growth.
- Classification: Mostly Dfc (Subarctic) in the Köppen system.
3. The Pacific Maritime Region
This is the sliver of land along the British Columbia coast, including Vancouver and Victoria.
- Climate Control: The Pacific Ocean. The water stays relatively warm in winter and cool in summer, moderating the air temperature.
- Precipitation: Extremely high, especially in winter, due to orographic lifting as moist air hits the Coast Mountains.
4. The Cordilleran Region
This covers the mountain systems of BC and the Yukon.
- Characteristics: Climate here is dictated by elevation. You can experience a temperate climate in a valley and a polar climate at a nearby peak.
- The Rain Shadow: As air moves east over the mountains, it loses moisture, creating much drier conditions on the eastern slopes and interior plateaus.
5. The Prairie Region
Spanning Alberta, Saskatchewan, and Manitoba, this region is known for its “continental” climate.
- Characteristics: Dry with extreme temperature swings. It features hot summers and very cold winters.
- Climate Control: Distance from the ocean and the mountain barrier to the west, which blocks moist Pacific air.
6. The Southeastern (Great Lakes-St. Lawrence) Region
This includes Southern Ontario and Quebec. It is the most populous region of Canada.
- Characteristics: Humid with hot, sticky summers and cold, snowy winters.
- Climate Control: The Great Lakes provide a slight moderating effect, but the region is frequently hit by warm, moist air from the Gulf of Mexico and cold, dry air from the north.
7. The Atlantic Maritime Region
This covers New Brunswick, Nova Scotia, Prince Edward Island, and Newfoundland.
- Characteristics: Similar to the Southeastern region but with more moderate temperatures and higher precipitation due to the Atlantic Ocean.
- The Labrador Current: This cold ocean current keeps the coastal areas (especially Newfoundland) cooler and foggier than they would otherwise be.
Summary Table of Canadian Climates
| Region | Sample City | Major Control | Notable Feature |
| Arctic | Iqaluit | Latitude | Polar Desert |
| Pacific | Vancouver | Ocean | High Winter Rain |
| Prairie | Calgary | Continentality | Chinook Winds |
| Southeastern | Toronto | Great Lakes | Humid Summers |
What are the global climates?
The term global climates refers to the large-scale patterns of temperature and precipitation that define the Earth’s surface. Because these patterns are consistent over decades, scientists categorize the world into distinct “climate zones” based on their distance from the equator, proximity to oceans, and elevation.
The most widely recognized way to define these is through the Köppen Climate Classification System, which identifies five primary groups.
1. Tropical Climates (Group A)
Located near the Equator, these regions are consistently warm throughout the year, with average temperatures never dropping below 18°C.
- Rainforests: High rainfall year-round (e.g., the Amazon).
- Savannas: Distinct wet and dry seasons (e.g., parts of sub-Saharan Africa).
- Monsoon: Seasonal shifts in wind that bring massive amounts of rain (e.g., Southeast Asia).
2. Dry (Arid) Climates (Group B)
In these regions, the amount of water lost through evaporation is greater than the amount gained through precipitation.
- Deserts: Extremely low rainfall; can be hot (Sahara) or cold (Gobi).
- Steppes: Semi-arid grasslands that act as a transition between deserts and more humid climates.
3. Temperate (Mesothermal) Climates (Group C)
These climates have distinct seasons with mild winters. They are typically found along the mid-latitude coasts.
- Mediterranean: Hot, dry summers and cool, wet winters (e.g., California, Italy).
- Marine West Coast: Cool summers and damp, cloudy winters (e.g., Western Europe, Pacific Northwest).
- Humid Subtropical: Hot, humid summers and mild winters (e.g., the Southeastern United States).
4. Continental (Microthermal) Climates (Group D)
These are found in the interior of large landmasses, mostly in the Northern Hemisphere. They feature large temperature swings between summer and winter.
- Humid Continental: Warm summers and snowy winters (e.g., much of Southern Canada and the Northeast US).
- Subarctic (Taiga): Short, cool summers and long, bitter winters (e.g., Central Russia and Northern Canada).
5. Polar Climates (Group E)
Located at the highest latitudes, these regions never experience a true summer. Every month of the year has an average temperature below 10°C.
- Tundra: The ground is permanently frozen (permafrost), and only low-growing plants like moss can survive.
- Ice Cap: Permanently covered in ice and snow (e.g., Antarctica and Greenland).
The Factors Driving These Climates
The distribution of these climates isn’t random. They are the result of several climate controls:
- Latitude: Determines the intensity of solar radiation.
- Global Wind Belts: Move moisture and heat around the planet (e.g., the Trade Winds and Westerlies).
- Ocean Currents: Warm currents (like the Gulf Stream) heat up coastal regions, while cold currents can create coastal deserts.
- Elevation: Temperatures drop as you go higher, creating “Highland” climates that don’t fit easily into the five horizontal bands.
What and where are tropical climates (A)?
Tropical climates, designated as Group A in the Köppen classification system, are defined by persistent heat and high humidity. In these regions, every month of the year has an average temperature of 18°C or higher. There is no “winter” season as understood in higher latitudes; instead, the seasons are defined by variations in rainfall.
Where are Tropical Climates Located?
These climates are found in a belt surrounding the Equator, generally between the Tropic of Cancer (23.5° N) and the Tropic of Capricorn (23.5° S).
- South America: The Amazon Basin and surrounding regions (Brazil, Colombia, Peru).
- Africa: The Congo Basin, the Guinea Coast, and parts of Madagascar.
- Asia: Southeast Asia (Indonesia, Philippines, Vietnam, Thailand) and parts of Southern India.
- Oceania: Northern Australia and the Pacific Islands.
The Three Types of Tropical Climates
While all “A” climates are hot, they differ significantly in how their rainfall is distributed throughout the year:
1. Tropical Rainforest (Af)
These areas are wet year-round with no distinct dry season. They are typically located directly on the Equator.
- Rainfall: High and consistent, often exceeding 2,000 mm annually.
- Feature: High biodiversity and dense, multi-layered “evergreen” forests.
- Mechanism: Constant low pressure and rising air (the ITCZ) create daily afternoon thunderstorms.
2. Tropical Monsoon (Am)
These regions experience extremely heavy rainfall during one part of the year and a short dry season during the other.
- Rainfall: Can be even higher than rainforests during the “wet” peak, but there is a clear seasonal dip.
- Feature: Found in coastal areas where seasonal wind shifts (monsoons) blow moist air off the ocean (e.g., coastal India and Bangladesh).
3. Tropical Wet and Dry / Savanna (Aw or As)
These are found further from the Equator, acting as a transition to the drier “B” climates.
- Rainfall: There is a prolonged dry season (often in the winter) where very little rain falls.
- Feature: Grasslands with scattered trees (savannas) rather than dense forests.
- Mechanism: These areas are under the influence of the wet ITCZ for part of the year and the dry Subtropical High for the rest.
Key Climate Controls for Group A
- Latitude: High solar radiation angles year-round provide constant energy.
- The ITCZ: This “thermal equator” is a band of clouds and rain that moves slightly north and south with the seasons, dictating when the rain falls.
- Ocean Proximity: Warm tropical ocean currents provide the massive amounts of water vapor needed to fuel these humid environments.
What and where are dry climates (B)?
Dry climates, designated as Group B in the Köppen classification system, are defined by a water deficit. In these regions, the potential evaporation (the amount of water that could evaporate if it were available) is greater than the actual amount of precipitation received.
Unlike other climate groups defined by temperature, Group B is defined primarily by aridity.
Where are Dry Climates Located?
Dry climates cover about 26% to 30% of the Earth’s land surface—more than any other climate group. They are typically found in three specific types of locations:
- Subtropical Highs (Latitudes 20° to 30°): This is where dry, heavy air from the Hadley Cell sinks, preventing cloud formation.
- Examples: The Sahara (Africa), the Arabian Desert (Middle East), and the Great Sandy Desert (Australia).
- Rain Shadows: Areas on the leeward side of major mountain ranges where moisture has been “squeezed out” on the windward slopes.
- Examples: The Great Basin (USA) and the Gobi Desert (Asia).
- Continental Interiors: Regions far from the moisture-providing oceans.
- Examples: Central Asia and the Canadian Prairies.
The Four Subdivisions of Group B
The “B” group is divided based on how dry it is (Desert vs. Steppe) and how hot it is (Hot vs. Cold).
1. Hot Desert (BWh)
These are the world’s “true” deserts. They feature scorching summers and very little rain (often less than 250 mm annually).
- Location: North Africa, Saudi Arabia, and parts of the Southwestern US/Mexico.
2. Cold Desert (BWk)
These regions are very dry but experience at least one month where the average temperature drops below freezing (0°C).
- Location: High-altitude or high-latitude deserts like the Gobi in Mongolia or the Patagonian Desert in Argentina.
3. Hot Steppe (BSh)
A “steppe” is a semi-arid grassland. It receives more rain than a desert but is still water-stressed. Hot steppes often surround hot deserts.
- Location: The Sahel region of Africa and parts of interior Australia.
4. Cold Steppe (BSk)
These are semi-arid regions with cold winters. They are common in the interior of large continents.
- Location: The Great Plains of North America (including parts of Southern Alberta and Saskatchewan) and the Steppes of Eurasia.
Key Climate Controls for Group B
- Subtropical High Pressure: The primary “dryness” engine. Sinking air warms adiabatically, which lowers its relative humidity and prevents rain.
- Continentality: The further a region is from the ocean, the less moisture the air carries by the time it arrives.
- Cold Ocean Currents: Along some coasts (like the Atacama in Chile), cold water chills the air from below. This stabilizes the atmosphere and prevents the air from rising to form rain clouds, creating “coastal deserts.”
[Image showing the global distribution of BWh, BWk, BSh, and BSk climates]
The Mathematical Threshold
Köppen used a specific formula to distinguish “B” climates from “A, C, and D” climates. It isn’t just a flat rain total; it accounts for seasonality. If rain falls mostly in the summer when heat is highest, the region needs more total rain to avoid being “Dry” than if the rain falls in the winter when evaporation is low.
What are where are temperate climates (C)?
Temperate climates, designated as Group C in the Köppen system, are characterized by distinct seasonal changes and moderate temperatures. They are often described as “Mesothermal,” meaning they sit in the middle of the thermal spectrum—neither as hot as the tropics nor as cold as the poles.
For a region to be classified as Group C, the coldest month must have an average temperature between -3°C and 18°C, and at least one month must average above 10°C.
Where are Temperate Climates Located?
These climates are typically found in the mid-latitudes, roughly between 25° and 50° latitude in both hemispheres. They are most common along the edges of continents where the ocean can moderate the air temperature.
- North America: The Pacific Northwest (Seattle, Vancouver), the Southeast US (Atlanta, Florida), and California.
- Europe: Most of Western and Central Europe (UK, France, Italy, Greece).
- Asia: Eastern China, Southern Japan, and parts of the Himalayas.
- Southern Hemisphere: Southeastern Australia, New Zealand, parts of South Africa, and central Chile.
The Three Main Types of Group C
The “C” group is subdivided based on when the rain falls and how hot the summers get.
1. Humid Subtropical (Cfa, Cwa)
These regions have hot, muggy summers and mild winters. They are usually found on the eastern sides of continents.
- Characteristics: High humidity and year-round rainfall. In the summer, they are dominated by moist maritime tropical air.
- Locations: Southeastern USA, Eastern China, and Northern Argentina.
2. Marine West Coast (Cfb, Cfc)
These climates are heavily influenced by the oceans, resulting in cool summers and mild, cloudy winters.
- Characteristics: Frequent overcast skies and persistent light rain or drizzle. The temperature range between summer and winter is relatively small.
- Locations: The Pacific Northwest of North America, the United Kingdom, New Zealand, and Southern Chile.
3. Mediterranean (Csa, Csb)
This is a unique climate where the “dry season” happens in the summer.
- Characteristics: Hot, dry summers and cool, wet winters. This is caused by the migration of subtropical high-pressure cells that block rain clouds during the summer months.
- Locations: The Mediterranean Basin, Coastal California, Western Australia, and the tip of South Africa.
Key Climate Controls for Group C
- Ocean Proximity: The high specific heat of water prevents these areas from getting as cold as the “Continental” interiors.
- The Westerlies: These prevailing winds carry moist air from the oceans onto the land, especially in Marine West Coast regions.
- Ocean Currents: Warm currents (like the Gulf Stream) help push Group C climates much further north than they would otherwise exist, particularly in Europe.
- Subtropical Highs: These pressure systems are responsible for the dry summers found in Mediterranean climates.
Why Group C is Significant
Temperate climates are home to a large percentage of the global population because the moderate temperatures and reliable rainfall are ideal for diverse agriculture and comfortable human habitation. Unlike Group D (Continental) climates, the winters in Group C are generally not severe enough to maintain a permanent snowpack.
Explain the observation of a desert with clouds and drizzle?
It seems counterintuitive to see clouds and a light drizzle in a desert—the very definition of a “Dry” (Group B) climate. However, this phenomenon is common in specific regions known as Coastal Deserts, such as the Atacama in Chile or the Namib in Africa.
This occurs due to a specific interaction between ocean currents and atmospheric stability.
1. The Role of Cold Ocean Currents
Most coastal deserts are located next to cold ocean currents (like the Humboldt or Benguela currents). These currents chill the air directly above the water’s surface.
- Advection: As warm, moist air moves over this cold water, it is cooled from below.
- Saturation: When the air cools to its dew point, the water vapor condenses into tiny droplets, forming low-lying clouds or thick fog (often called garúa or camanchaca).
2. Temperature Inversion (Atmospheric Stability)
In a typical atmosphere, air gets colder as you go higher. In these deserts, the process is flipped. The cold ocean air stays trapped under a layer of warmer, sinking air from the Subtropical High.
- The “Lid” Effect: This creates a temperature inversion. Because the cold air at the bottom is denser than the warm air above it, it cannot rise.
- No Thunderstorms: Without rising air (convection), the clouds cannot grow tall enough to produce heavy rain or thunderstorms. Instead, they stay as a flat, grey layer of Stratus clouds.
3. Drizzle vs. Rain
Because the clouds are “shallow” and lack vertical growth, the water droplets stay very small. They aren’t heavy enough to fall as large raindrops.
Instead, they manifest as:
- Drizzle: Fine droplets that stay suspended or fall very slowly.
- Mist/Fog: In many of these deserts, plants and animals have evolved to “harvest” this moisture directly from the air using silk-like webs or specialized leaves, as the drizzle rarely hits the ground with enough force to soak the soil.
4. Why it Stays a Desert
Despite the clouds and drizzle, these areas remain classified as deserts because the total annual precipitation is still extremely low. The inversion layer acts as a permanent barrier to the type of deep atmospheric lifting required for significant rainfall. You get the “gloom” of a rainy day without the actual water “bonus.”
What and where are cold climates?
Cold climates, designated as Group D (Continental) and Group E (Polar) in the Köppen system, are defined by their long, severe winters and limited summer warmth. While Group D climates have at least one month warm enough for trees to grow, Group E climates are so cold that the ground remains frozen or allows only the hardiest mosses to survive.
1. Continental Climates (Group D)
These are the “true” cold-winter climates. For a region to be classified as Group D, the coldest month must average -3°C or colder, and at least one month must average above 10°C.
Where are they?
Group D climates are almost exclusively found in the Northern Hemisphere. This is because the Southern Hemisphere lacks large enough landmasses at the correct latitudes to create a “continental” effect.
- North America: Most of Canada (including the Prairies and the North) and the Northern United States.
- Eurasia: Vast sections of Russia (Siberia), Northern China, Scandinavia, and Eastern Europe.
The Main Types:
- Humid Continental (Dfa/Dfb): These have hot or warm summers and are found in places like Toronto, Chicago, or Moscow. They receive reliable precipitation year-round.
- Subarctic (Dfc/Dfd): These have extremely long, bitter winters and very short summers. This is the realm of the Taiga (boreal forest).
2. Polar Climates (Group E)
In Polar climates, there is no true summer. Every single month of the year has an average temperature below 10°C.
Where are they?
These are found at the highest latitudes and highest elevations on Earth.
- The Arctic: The northern fringes of North America and Eurasia, and the Arctic Ocean ice.
- Antarctica: The entire continent is the world’s largest polar climate zone.
- Greenland: The interior ice sheet.
- High Mountains: Known as “Alpine” climates, these exist on the peaks of the Himalayas, Andes, and Rockies.
The Main Types:
- Tundra (ET): The warmest month is between 0°C and 10°C. The ground is often permafrost, meaning it stays frozen year-round just below the surface.
- Ice Cap (EF): Every month averages below 0°C. These areas are permanently covered in ice and snow.
Key Climate Controls for Cold Regions
- Latitude: The low angle of the sun means solar radiation is spread over a large area, providing very little heating energy.
- Continentality: Since land cools down much faster than water, the interiors of large continents (like the Canadian Prairies or Siberia) become “deep freezers” in the winter, far away from the moderating heat of the ocean.
- Albedo: Snow and ice reflect up to 90% of the sun’s energy back into space. This creates a feedback loop: the colder it gets, the more snow stays on the ground, which reflects more heat, making it even colder.
- High Pressure: Polar regions are often dominated by stable, sinking air (Polar Highs), which limits precipitation and leads to clear, frigid nights where heat escapes rapidly into the atmosphere.
Explain the drought cycle on the Canadian Prairies?
The drought cycle on the Canadian Prairies is a recurring atmospheric phenomenon driven by the region’s unique geography and its position within the global circulation. Because the Prairies are located in the “rain shadow” of the Rocky Mountains and far from the moderating influence of the oceans, they are naturally predisposed to periods of severe water scarcity.
The cycle typically follows a specific meteorological and hydrological progression:
1. The Trigger: Atmospheric Blocking
The onset of a prairie drought is usually caused by a stationary high-pressure ridge in the upper atmosphere, often referred to as an “Omega Block” due to its shape.
- The Mechanic: This ridge acts as a physical wall, diverting the jet stream and moisture-bearing low-pressure systems far to the north or south of the region.
- Subsidence: Inside this high-pressure zone, air is constantly sinking. As it sinks, it warms adiabatically, which lowers its relative humidity and prevents the formation of clouds and precipitation.
2. The Feedback Loop: Desiccation and Albedo
Once a dry spell begins, the land itself begins to reinforce the drought through a positive feedback loop:
- Soil Moisture Exhaustion: As the top layer of soil dries out, there is less water available for evapotranspiration. Usually, plants releasing moisture helps cool the air and provide “local” water vapor for afternoon thunderstorms. Without this, the air stays dry and gets even hotter.
- Sensible Heat Flux: Instead of solar energy being used to evaporate water (latent heat), it goes directly into heating the ground and the air (sensible heat). This causes temperatures to spike, further drying out any remaining moisture.
3. Influence of Teleconnections (El Niño/La Niña)
The prairie drought cycle is often synchronized with Pacific Ocean temperatures, specifically the El Niño-Southern Oscillation (ENSO):
- El Niño: Often brings warmer, drier winters to Western Canada. While not a guarantee of summer drought, it sets the stage by reducing the winter snowpack (the “spring bank account” for soil moisture).
- Pacific Decadal Oscillation (PDO): Longer-term shifts in Pacific temperatures can lock the Prairies into “dry phases” that last a decade or more, leading to multi-year “mega-droughts” like those seen in the 1930s and 1980s.
4. Hydrological Impact: The “Slow” Disaster
Unlike a flood, a drought is a “creeping” hazard. It moves through three stages:
- Meteorological Drought: A simple lack of precipitation.
- Agricultural Drought: Soil moisture drops so low that crops begin to wilt and fail.
- Hydrological Drought: Water levels in dugouts, rivers, and the water table drop significantly. Because many prairie rivers are fed by mountain snowmelt, a drought is often worsened if the mountain snowpack was thin the previous winter.
5. Breaking the Cycle: The Return of the Trough
The cycle only breaks when the upper-level “blocking” pattern collapses. This usually happens when the jet stream shifts back to a more zonal (west-to-east) flow, allowing moist Pacific air or “Colorado Lows” from the south to penetrate the region. However, after a severe drought, it often takes several seasons of above-average precipitation to fully recharge the deep soil moisture and aquifers.
What and where are polar climates (E)?
Polar climates, designated as Group E in the Köppen system, are the coldest environments on Earth. They are defined by a total lack of a true summer: every single month of the year has an average temperature below 10°C.
In these regions, the sun provides very little heating energy due to its low angle in the sky, and much of the energy that does reach the surface is reflected back into space by snow and ice.
Where are Polar Climates Located?
Polar climates are found at the highest latitudes of the Northern and Southern Hemispheres, as well as at extreme altitudes in high mountain ranges.
- Antarctica: The largest continuous polar climate zone on Earth.
- The Arctic: Including the Greenland Ice Sheet, the northern fringes of North America (Canada and Alaska), and Northern Eurasia (Siberia).
- High Altitudes: The peaks of the Himalayas, the Andes, and the Rockies (often referred to as Alpine Tundra).
The Two Subdivisions of Group E
The “E” group is divided into two distinct types based on whether the temperature ever rises above freezing.
1. Tundra (ET)
The Tundra is a transitional climate between the Subarctic forests and the permanent ice caps.
- Temperature: The warmest month averages between 0°C and 10°C.
- Vegetation: Trees cannot grow here. Instead, the landscape is dominated by grasses, sedges, mosses, and lichens.
- Permafrost: The ground is permanently frozen just below the surface. During the brief “summer,” the top layer (the active layer) thaws, creating bogs and marshes because the water cannot drain into the frozen earth below.
2. Ice Cap (EF)
This is the most extreme climate on Earth. There is no vegetation, and the landscape is permanently buried under layers of ice and snow.
- Temperature: Every month averages below 0°C.
- Precipitation: These areas are technically polar deserts. Because the air is so cold, it can hold almost no water vapor, resulting in very low annual snowfall.
- Locations: Interior Greenland and the vast majority of Antarctica.
Key Climate Controls for Group E
- Latitude: The primary control. At the poles, the sun’s rays travel through a thicker layer of atmosphere and strike the surface at a very shallow angle, spreading the energy thin.
- Albedo: The “Reflectivity” factor. Fresh snow reflects up to 90% of solar radiation. This prevents the ground from warming up even during the months of 24-hour daylight.
- Polar High Pressure: Stable, sinking air at the poles creates clear skies and calm winds, which allows heat to escape into space rapidly at night (Radiational Cooling).
- Elevation: In the case of Antarctica and Greenland, the massive thickness of the ice sheets (often over 3,000 meters) places the surface high in the colder upper atmosphere.
Life in the Polar Zone
Because the “growing season” is virtually non-existent, the biological cycle in Group E climates is extremely compressed. Animals must either migrate, hibernate, or possess specialized insulation (like blubber or hollow fur) to survive the persistent deficit of thermal energy.
What and where are highland climates?
Highland Climates (Group H)
In many climate classification systems, Highland climates (often designated as Group H) are treated as a unique category because they do not fit into the neat latitudinal bands of the Köppen system. Instead of being controlled by distance from the Equator, these climates are controlled primarily by elevation.
A Highland climate can essentially be thought of as a “vertical stack” of different climate zones existing in a single geographic location.
Where are Highland Climates Located?
Highland climates are found wherever there are significant mountain ranges or high-altitude plateaus. They exist at every latitude, from the Equator to the poles.
- North America: The Rocky Mountains, the Sierra Nevada, and the Cascades.
- South America: The entire length of the Andes.
- Asia: The Himalayas (the “Third Pole”), the Tibetan Plateau, and the Tien Shan.
- Europe: The Alps and the Pyrenees.
- Africa: The Ethiopian Highlands and Mount Kilimanjaro.
Key Characteristics: The “Vertical Zonation”
The most defining feature of a Highland climate is that as you climb higher, the climate changes rapidly over very short horizontal distances.
1. Temperature Lapse Rate
In the lower atmosphere, temperature decreases at an average rate of about 6.5°C for every 1,000 meters of elevation gain. This means that a tropical mountain can have a rainforest at its base and a permanent ice cap at its summit.
2. Precipitation and the Rain Shadow
Mountains act as physical barriers to air masses.
- Windward Side: As moist air is forced up the mountain (orographic lifting), it cools and releases heavy precipitation.
- Leeward Side: As the air descends on the other side, it warms and dries out, creating a rain shadow or arid environment.
3. High Diurnal Temperature Range
Because the air is thinner at high altitudes, it holds less heat and moisture. This leads to intense solar radiation during the day but rapid cooling at night, resulting in large temperature swings within a single 24-hour period.
The Life Zones of Group H
In a single Highland region, you might pass through several distinct “belts” of climate and vegetation:
- Lowland: Tropical or Temperate (depending on latitude).
- Montane: Cooler, often characterized by cloud forests or coniferous trees.
- Subalpine: The area just below the treeline, where trees become stunted and gnarled.
- Alpine Tundra: Above the treeline, where only low-growing plants survive.
- Nival (Snow): Above the snowline, where the ground is permanently covered in ice and snow.
Why Group H is a “Wildcard”
Highland climates are notoriously difficult to map because they are “mosaics.” A valley might be warm and dry while a peak just 5 kilometers away is frozen and windswept. For meteorologists and mapping technologists, this requires high-resolution data to accurately model the complex microclimates created by the rugged topography.
Solved Problems
Since we have been exploring global climate systems, classification, and regional anomalies, I have compiled a set of 15 high-level problems. These are designed to bridge the gap between theoretical meteorology and practical mapping/data analysis, focusing on the “why” and “how” of the solutions.
1. Calculating the Vertical Temperature Gradient
Problem: A weather station at the base of a mountain (500 m) records 22°C. If the Environmental Lapse Rate (ELR) is 6.5°C per 1,000 m, what is the temperature at a summit of 3,500 m?
- Thought Process: Calculate the elevation difference (3,000 m). Multiply the change in altitude (in km) by the lapse rate (3 * 6.5 = 19.5). Subtract this cooling from the base temperature.
- Solution: 2.5°C.
2. Determining the “Dryness Threshold” (Pth)
Problem: A region has a mean annual temperature of 20°C. Most rain falls in the winter. Is 350 mm of annual rain enough to classify it as a Humid climate or a Dry (B) climate?
- Thought Process: Köppen’s formula for winter-dominant rain is Pth = 2 * T (2 * 20 = 400 mm). If actual P < Pth, it is a Dry climate.
- Solution: Since 350 < 400, it is a Dry (B) climate.
3. The Orographic Lifting Moisture Loss
Problem: Moist air at 15°C at sea level is forced over a 2,000 m ridge. It reaches the dew point at 1,000 m. What happens to the temperature and moisture as it descends the other side to sea level?
- Thought Process: Air cools at the Dry Adiabatic Lapse Rate (DALR) until 1,000 m, then at the Saturated Adiabatic Lapse Rate (SALR) to the peak. On descent, it warms at the DALR (10°C/1,000 m) the entire way down.
- Solution: The air will be significantly warmer and drier at the base of the leeward side (the Rain Shadow effect).
4. Sea Surface Temperature (SST) and Hurricanes
Problem: Why is a global temperature increase of 1°C more significant for hurricane intensity than a 1°C increase in land temperature?
- Thought Process: Water has a higher specific heat capacity than land. It stores more energy. Hurricanes are heat engines fueled by latent heat from evaporating sea water.
- Solution: Higher SSTs provide exponentially more fuel (latent heat) for storm intensification compared to atmospheric heating alone.
5. Identifying a Mediterranean Climate (Cs)
Problem: You are looking at a climograph with a mild winter (10°C) and a hot summer (25°C). The rain falls almost exclusively in the winter months. Which Köppen code applies?
- Thought Process: Mild winter = Group C. Dry summer = ‘s’. Hot summer = ‘a’.
- Solution: Csa.
6. Albedo Feedback Modeling
Problem: If the Arctic ice cap melts and is replaced by dark ocean water, how does the energy balance change?
- Thought Process: Ice albedo is ≈ 0.90 (reflects 90%). Ocean albedo is ≈ 0.06 (absorbs 94%).
- Solution: The surface shifts from a reflector to an absorber, creating a positive feedback loop that accelerates local warming.
7. The ITCZ and Seasonal Rain
Problem: Why does a city at 15° N latitude have a distinct summer “monsoon” but a bone-dry winter?
- Thought Process: The Intertropical Convergence Zone (ITCZ) follows the “thermal equator.” It migrates north in the Northern Hemisphere summer, bringing rain, and retreats south in the winter.
- Solution: The seasonal migration of the low-pressure belt (ITCZ).
8. Continentality and Temperature Range
Problem: Compare Winnipeg, MB and Vancouver, BC. Both are at similar latitudes. Why does Winnipeg have a temperature range of 40°C while Vancouver’s is only 15°C?
- Thought Process: Vancouver is moderated by the Pacific Ocean (Maritime). Winnipeg is in the center of a landmass (Continental).
- Solution: Continentality—land heats and cools much faster than water.
9. Calculating Potential Evapotranspiration (PET)
Problem: In a Thornthwaite model, if a region receives $100$ mm of rain but the PET is $150$ mm, what is the status of the “water bank”?
- Thought Process: P – PET = Surplus/Deficit. 100 – 150 = -50.
- Solution: A water deficit of 50 mm; plants will experience moisture stress.
10. The Chinook Wind Mechanism
Problem: How can a temperature in Southern Alberta rise from -15°C to +5°C in just a few hours?
- Thought Process: Adiabatic warming. As air descends the eastern slopes of the Rockies, it is compressed by increasing atmospheric pressure.
- Solution: Compression results in adiabatic heating at the dry rate of 10°C per 1,000 m of descent.
11. Polar Desert Paradox
Problem: Why is the South Pole considered a desert if it is covered in thousands of meters of ice?
- Thought Process: Definition of a desert is based on precipitation, not the amount of water present as ice. Extremely cold air holds almost zero water vapor.
- Solution: Very low annual snowfall makes it a Polar Desert (EF).
12. Identifying a Tundra Climate (ET)
Problem: A location has 12 months of data. The warmest month is $8^\circ C$ and the coldest is $-30^\circ C$. Is this Group D or Group E?
- Thought Process: Group D requires at least one month $> 10^\circ C$. Group E is always $< 10^\circ C$.
- Solution: Group E (Tundra/ET) because the warmest month is below the $10^\circ C$ threshold.
13. The Influence of the Gulf Stream
Problem: London, UK is further north than Calgary, AB. Why are London’s winters so much milder?
- Thought Process: Look at ocean currents. The North Atlantic Drift (extension of the Gulf Stream) brings warm tropical water to the European coast.
- Solution: Advection of heat via warm ocean currents.
14. Urban Heat Island (UHI) Mapping
Problem: Why does a satellite infrared map show a city center at $32^\circ C$ while the surrounding suburbs are at $27^\circ C$?
- Thought Process: Surface materials. Concrete and asphalt have low albedo and high heat storage compared to vegetation.
- Solution: Urban Heat Island Effect, caused by low albedo and lack of evapotranspiration in paved areas.
15. The Rain Shadow and Agriculture
Problem: You are mapping soil zones. Why is the soil on the east side of a mountain range consistently more alkaline and nutrient-poor than the west side?
- Thought Process: Precipitation levels. The west side (windward) gets heavy rain, leaching nutrients. The east side (leeward) is dry, leading to less leaching but also less organic matter.
- Solution: The Rain Shadow creates an arid environment that limits soil development.