
Meteorology Today Second Canadian Edition
Earth and Atmospheric Sciences
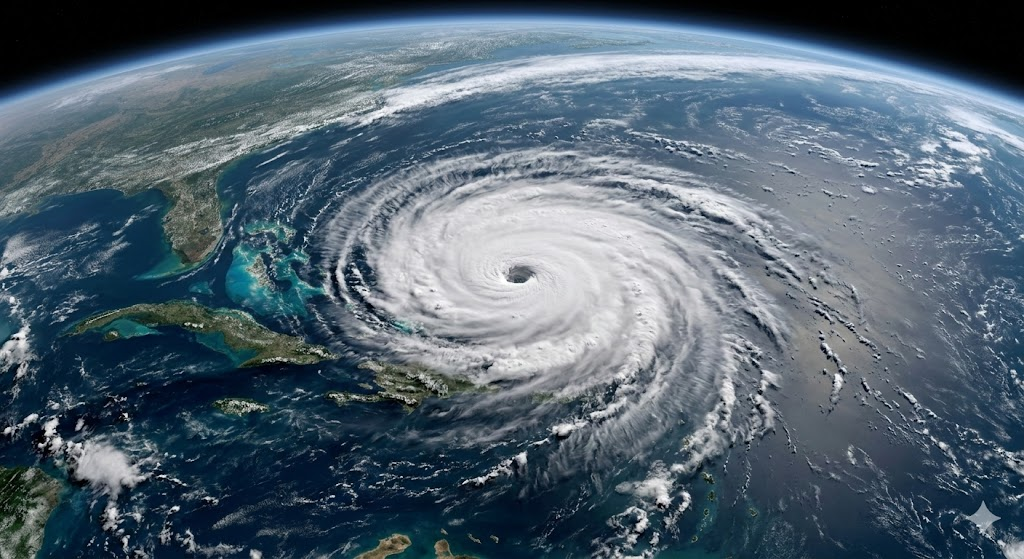
At their simplest, hurricanes are massive, rotating storm systems characterized by low atmospheric pressure, strong winds, and heavy rain. They form over warm ocean waters and act like giant engines that convert heat from the tropical ocean into wind and rain.
Technically known as tropical cyclones, these storms are called “hurricanes” when they form in the North Atlantic, central North Pacific, or eastern North Pacific. In other parts of the world, they are known as typhoons (Western Pacific) or simply cyclones (Indian Ocean and South Pacific).
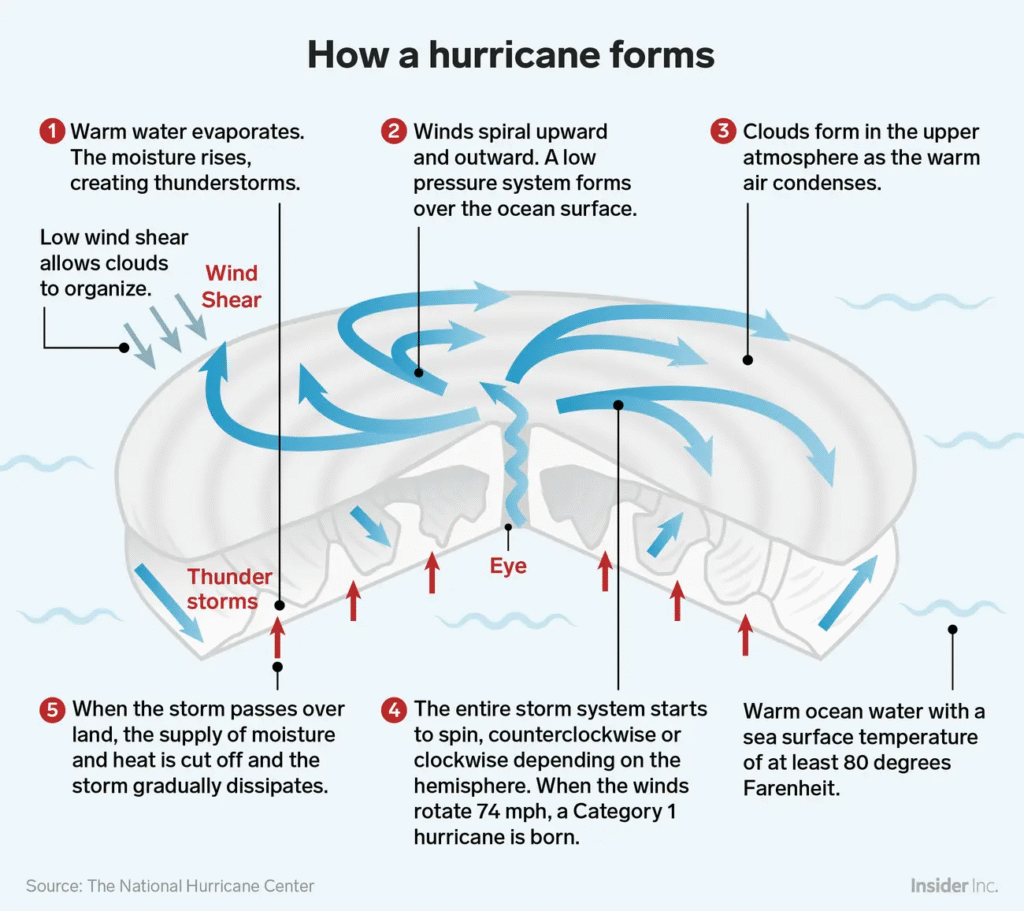
How They Form
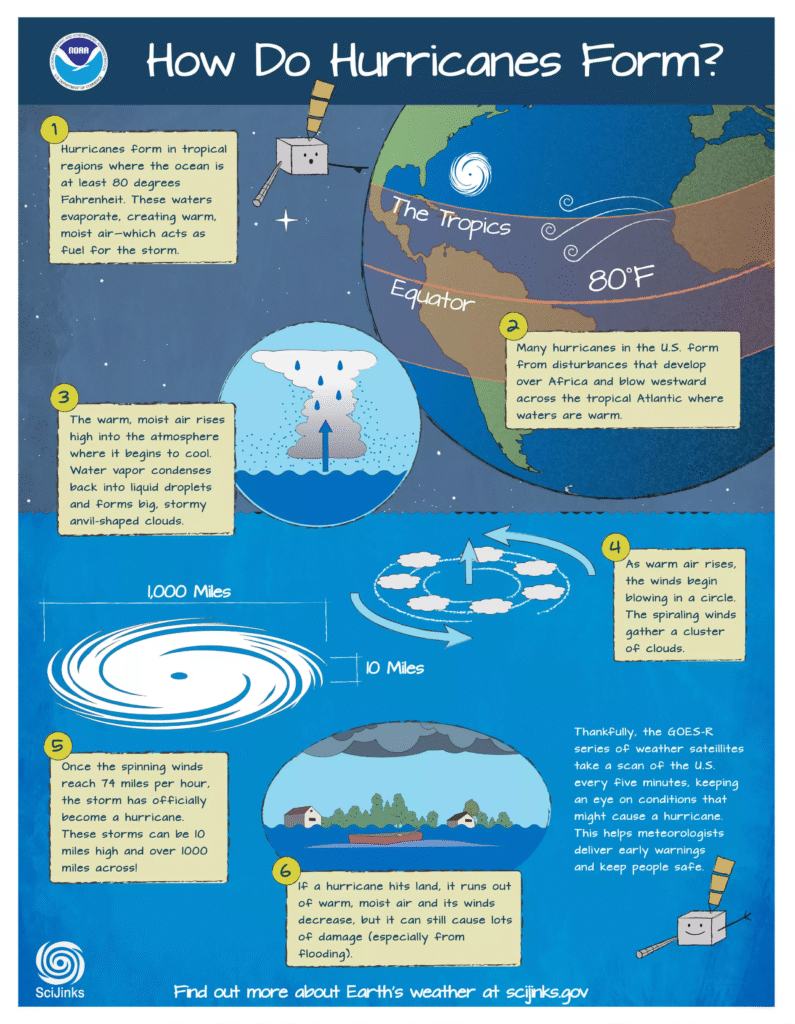
For a hurricane to develop, several specific environmental “ingredients” must be present:
- Warm Ocean Water: The surface water must be at least 26.5°C (80°F). This provides the “fuel” for the storm.
- Moist Air: High humidity in the lower-to-mid troposphere helps clouds form and prevents the evaporation of rain.
- Low Wind Shear: This means the wind speed and direction don’t change much as you go higher in the atmosphere. High wind shear can “rip” a developing storm apart.
- The Coriolis Effect: This is the force created by the Earth’s rotation. It causes the storm to spin. This is why hurricanes don’t form right on the equator (where the effect is too weak).
The Structure of a Hurricane
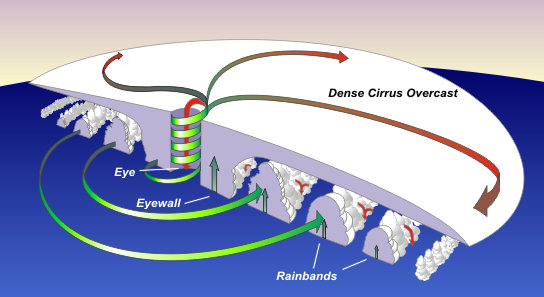
A mature hurricane is a complex, three-dimensional structure with three main parts:
- The Eye: The calm, clear center of the storm. Winds are light here, and the sky is often blue or clear at night.
- The Eyewall: The ring of intense thunderstorms surrounding the eye. This is where the most destructive winds and heaviest rains are found.
- Rainbands: Long arches of clouds and thunderstorms that spiral outward from the eyewall. They can extend hundreds of kilometers from the center.
Classification: The Saffir-Simpson Scale
Hurricanes are categorized based on their sustained wind speeds. As wind speeds increase, the potential for property damage and life-threatening storm surges rises.
| Category | Wind Speeds (km/h) | Damage Level |
| Category 1 | 119–153 | Dangerous winds; some damage |
| Category 2 | 154–177 | Extremely dangerous; substantial damage |
| Category 3 | 178–208 | Devastating damage (Major Hurricane) |
| Category 4 | 209–251 | Catastrophic damage |
| Category 5 | 252 or higher | Absolute catastrophe |
Key Hazards
While wind is the most famous feature, it is often not the deadliest. The main threats include:
- Storm Surge: A literal “mound” of water pushed toward the shore by the winds, leading to coastal flooding.
- Inland Flooding: Heavy rainfall can cause massive flooding far from the coast.
- Tornadoes: Hurricanes can spawn smaller, intense tornadoes within their rainbands.
What is the nature of tropical weather?
Tropical weather is fundamentally different from the weather in mid-latitude regions (like North America or Europe) because it is driven by convection and moisture rather than the clashing of massive cold and warm air masses.
In the tropics—the region between the Tropic of Cancer (23.5° N) and the Tropic of Capricorn (23.5° S)—the sun’s rays are nearly vertical year-round. This creates a consistent heat engine that dictates almost every atmospheric process.
1. Lack of Temperature Contrast
In higher latitudes, weather is defined by fronts (cold fronts, warm fronts). In the tropics, horizontal temperature gradients are very weak.
- Uniformity: The temperature over the ocean might only vary by a few degrees between day and night.
- Pressure: Because temperature is uniform, pressure gradients are also weak. You won’t see the intense “Highs” and “Lows” common in temperate zones; instead, weather is influenced by subtle troughing.
2. The Role of the ITCZ
The Intertropical Convergence Zone (ITCZ) is the “meteorological equator.” It is a belt of low pressure where the Trade Winds from the Northern and Southern Hemispheres meet.
- Convective Activity: As these winds converge, the moist air is forced upward, creating a near-constant band of thunderstorms and heavy rainfall.
- Migration: The ITCZ shifts north and south with the seasons, which is what defines “Wet” and “Dry” seasons rather than “Summer” and “Winter.”
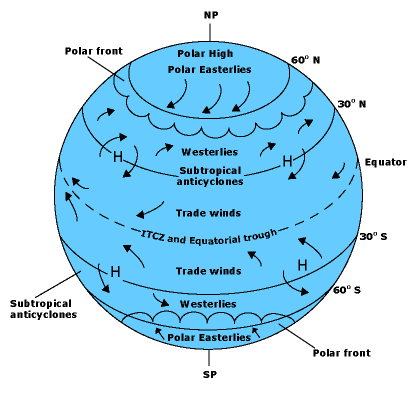
3. Dominance of the Trade Winds
The tropics are dominated by the Trade Winds—steady winds that blow from the northeast in the Northern Hemisphere and the southeast in the Southern Hemisphere.
- Inversion Layers: Often, a “Trade Wind Inversion” acts as a lid on the atmosphere, keeping clouds shallow. When this lid is broken by a disturbance, massive thunderstorms erupt.
- Easterly Waves: These are ripples in the trade winds that travel from east to west. They are the “seeds” for most tropical cyclones (hurricanes).
4. Moisture and Latent Heat
Water vapor is the primary currency of tropical weather.
- Latent Heat Release: When water vapor condenses into clouds, it releases energy (latent heat). In the tropics, this energy is the primary fuel for the atmospheric circulation.
- Diurnal Cycle: Tropical weather often follows a strict clock. Solar heating builds up moisture during the day, leading to intense, localized afternoon downpours that dissipate quickly after sunset.
5. Summary: Tropics vs. Mid-Latitudes
| Feature | Mid-Latitudes | Tropics |
| Primary Driver | Temperature gradients (Fronts) | Convection & Moisture |
| Wind Pattern | Westerlies (West to East) | Trade Winds (East to West) |
| Seasons | Temperature-based (4 Seasons) | Rainfall-based (Wet/Dry) |
| Coriolis Force | Strong | Weak to Zero (at equator) |
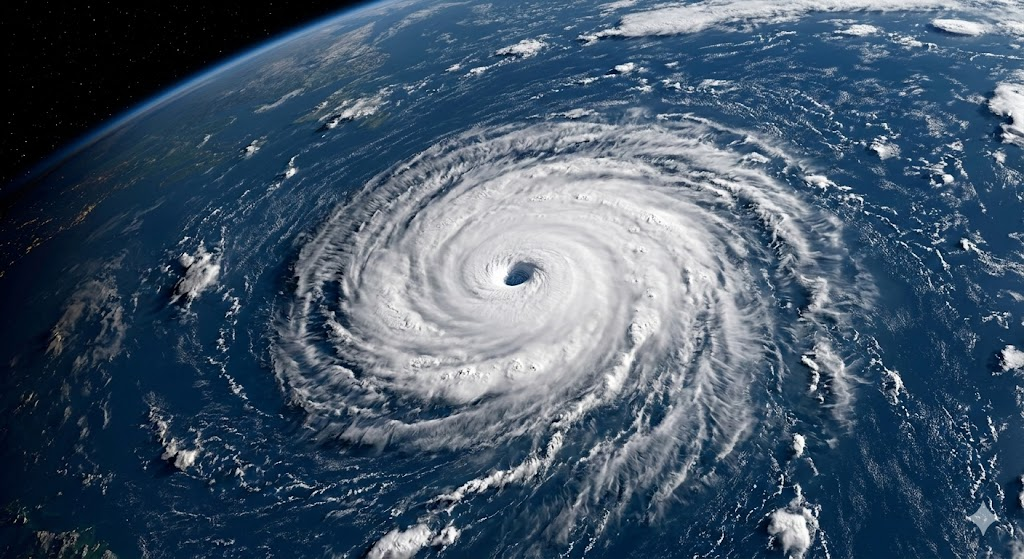
What is the anatomy of a hurricane?
The anatomy of a hurricane is a sophisticated thermal engine. To understand how it functions, we look at it as a three-dimensional structure of rising and sinking air, driven by the release of latent heat.
The storm is organized into three primary regions, each defined by distinct pressure, wind, and cloud characteristics.
1. The Eye: The Center of Calm
At the very center of a mature hurricane lies the eye, a roughly circular area typically 30–65 km in diameter.
- Low Pressure: This is where the storm’s surface pressure is at its absolute minimum.
- Subsidence: The air within the eye is actually sinking slowly from high altitudes. As air sinks, it warms adiabatically, which causes clouds to evaporate and results in clear skies or light winds.
- The “Stadium Effect”: In intense hurricanes, the clouds of the surrounding eyewall curve outward with height, making the eye look like a massive white stadium.
2. The Eyewall: The Engine Room
Surrounding the eye is the eyewall, a dense ring of convection and the most dangerous part of the storm.
- Maximum Winds: This is where the strongest sustained winds and heaviest precipitation are located.
- Vertical Velocity: Moist air from the ocean surface spirals inward toward the center, then abruptly turns upward, rising at high speeds to the top of the troposphere.
- Energy Release: Huge amounts of latent heat are released here as water vapor condenses into rain, which provides the energy that lowers the central pressure and fuels the wind.
3. Spiral Rainbands: The Outer Reaches
Stretching outward from the eyewall for hundreds of kilometers are the spiral rainbands.
- Squalls: These are long arches of clouds and thunderstorms that rotate slowly counter-clockwise (in the Northern Hemisphere) around the center.
- Intermittent Intensity: Unlike the constant fury of the eyewall, rainbands bring “bursts” of heavy rain and wind, separated by periods of lighter rain or even overcast skies.
- Tornado Risk: The friction and wind shear found in these outer bands often provide the necessary conditions for brief, intense tornadoes when the storm makes landfall.
The Outflow: The Exhaust System
At the very top of the hurricane (near the tropopause), the air that rose through the eyewall must go somewhere.
- Anticyclonic Flow: While the surface winds spiral inward (convergence), the air at high altitudes spirals outward (divergence) in a clockwise direction.
- Efficiency: A healthy “exhaust” system is vital. If the air cannot exit the top of the storm efficiently, the “engine” will choke, and the hurricane will weaken.
Summary Table: Structural Dynamics
| Feature | Vertical Air Motion | Pressure | Weather Conditions |
| Eye | Sinking (Subsiding) | Lowest | Clear skies, calm winds |
| Eyewall | Rising (Convective) | Low/Falling | Violent winds, torrential rain |
| Rainbands | Rising/Falling | Moderate | Gusty winds, heavy squalls |
| Outflow | Outward (Divergent) | High (Relative) | Cirrus “shield” clouds |
What causes hurricane formation and dissipation?
The life cycle of a hurricane is a balance between its energy source—warm ocean water—and the atmospheric conditions that either support or disrupt its “heat engine.”
1. The Causes of Formation (The Tropical Heat Engine)
For a hurricane to form, a specific set of thermodynamic and dynamic conditions must align. Meteorologists often refer to these as the “six ingredients” for tropical cyclogenesis:
- Ocean Thermal Energy: Sea surface temperatures must be at least 26.5°C (80°F) down to a depth of about 50 meters. This provides the massive amount of sensible and latent heat required to fuel the storm.
- Atmospheric Instability: The atmosphere must be unstable enough to allow moist air to rise through convection. As this air rises and cools, water vapor condenses, releasing latent heat which further warms the surrounding air and lowers surface pressure.
- High Mid-Level Humidity: Dry air in the mid-troposphere can cause “entrainment,” where evaporating rain cools the air and creates downdrafts that “choke” the rising thunderstorms.
- Pre-existing Disturbance: A hurricane doesn’t start from scratch; it needs a “seed,” such as an African Easterly Wave or a low-pressure trough, to initiate organized cloud cover and rotation.
- Low Vertical Wind Shear: This is critical. If winds at high altitudes are much stronger or in a different direction than winds at the surface, the storm’s chimney-like structure is tilted or ripped apart, preventing the concentration of heat.
- Coriolis Force: The storm needs the Earth’s rotation to induce a spin. This force is zero at the equator, which is why hurricanes rarely form within $5^\circ$ of the equator.
2. The Causes of Dissipation (The End of the Engine)
A hurricane begins to weaken or dissipate as soon as its energy supply is cut off or its internal structure is compromised.
- Landfall: This is the most common cause of rapid weakening. When a storm moves over land, it loses its primary fuel source (moist, warm ocean air). Additionally, increased surface friction from terrain, trees, and buildings slows the surface winds and causes air to flow more directly into the center, “filling” the low-pressure eye.
- Cold Water (Upwelling): If a hurricane moves over colder water (less than 26.5°C) or remains stationary for too long, it can dissipate. Stationary storms churn the ocean, bringing colder water from the depths to the surface—a process called upwelling—which effectively starves the storm of heat.
- Strong Wind Shear: If the storm encounters an environment with high wind shear (often caused by the Jet Stream), the top of the storm is pushed away from the bottom. This prevents the latent heat from concentrating over the center, causing the pressure to rise and the winds to decay.
- Dry Air Intrusion: Large plumes of dry, dusty air (such as the Saharan Air Layer) can be sucked into the storm’s circulation. This evaporates the clouds and creates cold, sinking air that opposes the necessary upward convection.
- Extratropical Transition: In higher latitudes, a hurricane may merge with a cold front or move into a colder environment. It loses its “warm core” and transforms into an extratropical cyclone, fueled by temperature contrasts rather than latent heat.
Summary Table: Strengthening vs. Weakening
| Factor | Strengthening (Intensification) | Weakening (Dissipation) |
| Ocean Temp | >26.5°C | <26.5°C or Landfall |
| Wind Shear | Low (allows vertical stacking) | High (tilts/tears the storm) |
| Air Mass | Moist, tropical air | Dry, dusty, or continental air |
| Upper Levels | Strong Outflow (Exhaust) | Weak or restricted outflow |
What is the right environment?
For a hurricane to transition from a disorganized cluster of thunderstorms into a self-sustaining “heat engine,” it needs an environment that balances thermodynamic energy with atmospheric stability.
Meteorologists generally look for six key environmental factors that must coincide for a tropical cyclone to form and thrive:
1. Thermal “Fuel” (The Ocean)
The ocean acts as the battery for the storm.
- Sea Surface Temperature (SST): The water must be at least 26.5°C (80°F).
- Ocean Heat Content: It isn’t just the surface that matters; the warm water needs to extend down about 50 meters. If the warm layer is too thin, the storm’s own waves will churn up cold water from below (upwelling), effectively “starving” itself.
2. Atmospheric Instability
The environment must be unstable enough to encourage deep convection. This means the air near the surface must be significantly warmer and more buoyant than the air above it, allowing massive towers of cumulonimbus clouds to rise to the top of the troposphere.
3. Mid-Level Moisture
Dry air is a hurricane killer. The middle layers of the atmosphere (around 3 to 5 km up) must be nearly saturated.
- If the air is dry, falling rain will evaporate before hitting the ocean.
- Evaporation is a cooling process, which creates strong downdrafts of cold air that disrupt the upward flow of the storm’s “engine.”
4. Low Vertical Wind Shear
This is perhaps the most delicate part of the environment. Wind shear is the change in wind speed or direction with height.
- The Goal: Low shear (less than 20 knots of difference between the surface and the upper atmosphere).
- The Result: This allows the storm to stay “vertically stacked.” If shear is high, the top of the storm is blown away from the base, preventing the heat from concentrating over the center.
5. A Pre-existing Disturbance
Hurricanes do not spontaneously generate from clear skies. They need a “seed” to get the air spinning and rising. Common “seeds” include:
- African Easterly Waves: Ripples in the trade winds moving off the coast of Africa.
- The ITCZ: Areas of convergence near the equator.
- Old Frontal Boundaries: Stationary fronts that have drifted into tropical waters.
6. The Coriolis Effect (Distance from Equator)
The environment must be far enough away from the equator—typically at least 500 km (5° of latitude)—to leverage the Earth’s rotation. Without the Coriolis force, the air would simply flow straight into the low-pressure center and fill it up, rather than spiraling around it to create the iconic “vortex” shape.
Environmental Summary Table
| Environmental Factor | Ideal Condition | Why it Matters |
| Water Temp | >26.5°C | Provides the latent heat energy. |
| Wind Shear | Low (<10 m/s) | Keeps the “heat chimney” vertical. |
| Humidity | High (Mid-levels) | Prevents cold downdrafts from dry air. |
| Latitude | >5° North/South | Provides the necessary “spin” (Coriolis). |
What causes the developing storm?
A developing storm—specifically a tropical cyclone—is caused by the concentration of latent heat within a localized area of the atmosphere. It begins when a massive amount of warm, moist air is forced upward, creating a cycle that eventually becomes a self-sustaining “heat engine.”
Here is the step-by-step breakdown of what causes that initial development:
1. The Trigger (The Pre-existing Disturbance)
A storm doesn’t start from thin air; it needs a “seed” to begin lifting the atmosphere.
- Easterly Waves: These are ripples of low pressure that move from east to west across the tropics (often originating over Africa).
- Convergence: In the Intertropical Convergence Zone (ITCZ), trade winds from the north and south collide, forcing the moist air at the surface to rise.
2. The Lift (Convection)
When the warm, moist air over the tropical ocean ($>26.5^\circ\text{C}$) rises, it begins to cool.
- Condensation: As the air cools, the water vapor turns back into liquid water (forming clouds).
- Latent Heat Release: This is the most critical part. When water vapor condenses, it releases a massive amount of stored energy called latent heat.
- The Feedback Loop: This heat warms the surrounding air, making it even more buoyant and causing it to rise faster. This creates a “chimney effect” that pulls more moist air up from the ocean surface.
3. The Drop (Pressure Fall)
As more air is pulled up and away from the ocean surface, the weight of the atmosphere in that specific spot decreases.
- Surface Low Pressure: This creates a “void” or a region of low pressure at the sea’s surface.
- Inflow: Nature abhors a vacuum, so air from the surrounding high-pressure areas rushes toward this new low-pressure center to fill the gap.
4. The Spin (The Coriolis Effect)
As the air rushes toward the center, it doesn’t move in a straight line.
- Deflection: Because the Earth is rotating, the Coriolis Force deflects the incoming air to the right (in the Northern Hemisphere).
- Vortex Formation: This deflection causes the air to spiral inward, creating the circular rotation we recognize as a tropical depression or storm.
5. Consolidation (Organization)
For the development to continue, the storm must become “organized.”
- Vertical Stacking: If there is low wind shear, the rising column of heat stays directly over the surface low pressure.
- Centralization: The thunderstorms begin to align in bands around the center. Once the winds reach 63 km/h (39 mph), it is classified as a Tropical Storm.
Summary of the “Chain Reaction”
- Heat + Moisture ➞ Rising Air (Convection)
- Convection ➞ Condensation (Latent Heat Release)
- Latent Heat ➞ Warming the air (Increased Buoyancy)
- Rising Air ➞ Dropping Surface Pressure
- Low Pressure ➞ Inward Wind + Earth’s Rotation (Spin)
Why does the storm die out?
A hurricane is a high-performance heat engine, and like any engine, it “dies” when its fuel source is removed, its internal mechanics are disrupted, or its exhaust system is blocked.
The technical term for this is dissipation, and it typically happens for four primary reasons:
1. Landfall: Friction and Fuel Depletion
Moving over land is the most common cause of a storm’s rapid decay.
- Loss of Latent Heat: The ocean provides a constant supply of warm, moist air. Land surfaces (even wet ones) cannot provide the massive amount of moisture needed to sustain the “engine.” Without this fuel, the central pressure begins to rise immediately.
- Surface Friction: Land is much “rougher” than the ocean. Trees, buildings, and hills create friction that slows down surface winds. This causes the air to spiral more directly into the low-pressure center, “filling” the eye and weakening the pressure gradient.
2. Cold Water (The “Cold Wake”)
If a storm moves into higher latitudes or over a patch of ocean cooler than 26.5°C (80°F), it loses its thermal energy.
- Self-Induced Weakening (Upwelling): If a hurricane moves very slowly or stalls, its powerful winds churn the ocean. This brings cold water from the deep up to the surface. The storm effectively “strangles” itself by cooling its own fuel source.
3. Vertical Wind Shear
For a storm to stay strong, the “chimney” of rising heat must stay perfectly vertical.
- Structural Collapse: High-level winds (like the Jet Stream) can blow at different speeds or directions than the surface winds. This “rips” the top of the storm away from its base.
- Vortex Tilt: Once the storm is tilted, the latent heat release is spread over a wider area rather than being concentrated over the center, causing the central pressure to rise and the winds to drop.
4. Dry Air Intrusion
If a storm sucks in a large volume of dry, stable air (such as the Saharan Air Layer), the results are devastating to the system.
- Evaporative Cooling: When rain falls through dry air, it evaporates. Evaporation cools the air, making it heavy and causing it to sink rapidly.
- Downdraft Interference: These cold downdrafts act as “anti-fuel,” fighting against the warm updrafts needed to keep the storm organized.
5. Extratropical Transition
Sometimes a storm doesn’t technically “die” but transforms. As it moves north into the mid-latitudes, it loses its “warm core” and merges with a cold front. It becomes an extratropical cyclone—driven by temperature differences between air masses rather than ocean heat. This is often how storms impact Atlantic Canada or the UK.
Summary: The Dissipation Checklist
| Factor | Effect on the Storm |
| Landfall | Cuts off moisture; increases friction. |
| Cold Water | Lowers the energy (latent heat) available. |
| High Wind Shear | Physically tilts and deconstructs the vortex. |
| Dry Air | Creates cold downdrafts that choke convection. |
What are the hurricane stages of development?
The development of a hurricane is a process of organization. A storm moves through four distinct stages defined by its structure and its maximum sustained surface wind speeds.
Meteorologists track these stages to determine the level of threat and to decide when to officially “name” a system.
1. Tropical Disturbance
This is the “birth” of the storm. It appears on satellite as a disorganized cluster of clouds and thunderstorms.
- Structure: There is no rotation yet, and no “eye.”
- Winds: Winds are light, and there is no closed isobar (a line of equal pressure) circling the center.
- Duration: Most disturbances dissipate within 24 hours, but if they move over warm water with low wind shear, they can begin to organize.
2. Tropical Depression
A disturbance becomes a Tropical Depression when it develops a clear horizontal circulation (it starts to spin).
- Structure: On a weather map, you will see at least one closed isobar. The storm begins to take on a more circular shape, though it still looks “lumpy” on satellite.
- Winds: Sustained winds are less than 63 km/h (39 mph).
- Naming: At this stage, the storm is not named; it is assigned a number (e.g., “Tropical Depression Ten”).
3. Tropical Storm
The transition to a Tropical Storm is a significant milestone. This is when the “heat engine” has become efficient enough to produce strong, consistent winds.
- Structure: The storm becomes more symmetric. Rainfall begins to organize into distinct “spiral bands” that rotate around a central point.
- Winds: Sustained winds are between 63 and 118 km/h (39–73 mph).
- Naming: This is the stage where the storm is officially given a name from the pre-determined WMO list (e.g., “Tropical Storm Alberto”).
4. Hurricane (Tropical Cyclone)

The final stage is reached when the inner core becomes so intense that an eye often forms in the center.
- Structure: A well-defined center of very low pressure is surrounded by a violent eyewall. The “outflow” at the top of the storm is now fully functional, acting like an exhaust pipe.
- Winds: Sustained winds reach 119 km/h (74 mph) or higher.
- Classification: Once it reaches this stage, it is further ranked on the Saffir-Simpson Scale (Categories 1 through 5) based on its wind speed.
Summary Table: Development Stages
| Stage | Wind Speed (km/h) | Key Characteristic |
| Disturbance | Variable/Light | Disorganized thunderstorms; no rotation. |
| Depression | Up to 62 km/h | Organized circulation begins; assigned a number. |
| Tropical Storm | 63–118 km/h | Stronger rotation; spiral bands; assigned a name. |
| Hurricane | 119+ km/h | Eye often forms; intense eyewall; categorized 1–5. |
Do scientists see any shortcomings of the Saffir-Simpson scale and do they see any alternatives?
The Saffir-Simpson Hurricane Wind Scale (SSHWS) has been the primary tool for communicating hurricane risk since the 1970s. However, as of 2026, a growing segment of the scientific community argues that the scale is increasingly “not fit for purpose” in a warming world.
Scientists categorize the shortcomings of the scale into three main areas: the “Open-Ended” problem, the “Water-vs-Wind” gap, and the “Size” neglect.
1. The Shortcomings of Saffir-Simpson
A. The “Category 6” Debate (The Ceiling Problem)
The scale currently maxes out at Category 5 (winds $\ge 252$ km/h). Because the scale is open-ended, it treats a 255 km/h storm the same as a 315 km/h storm.
- The Issue: The destructive power of wind increases exponentially, not linearly. A storm with 300 km/h winds has significantly more “kinetic energy” and potential for destruction than one at 252 km/h.
- The 2026 Perspective: Recent studies (such as Wehner & Kossin, 2024) propose a Category 6 (for winds $> 309$ km/h) to better communicate the “unprecedented” nature of supercharged storms like Typhoon Haiyan or Hurricane Patricia.
B. The Water Gap (The 90% Problem)
The SSHWS is a wind-only scale. However, statistics show that roughly 90% of hurricane-related fatalities are caused by water (storm surge and freshwater flooding), not wind.
- The Issue: A “weak” Category 1 storm that moves slowly (like Hurricane Florence or Harvey) can drop more rain and cause more deaths than a “strong” Category 4 that moves quickly. The scale can lead to a “false sense of security” where residents refuse to evacuate because “it’s only a Cat 1.”
C. Neglect of Storm Size
The scale only measures the maximum sustained wind at a single point (the eyewall). It ignores how large the wind field is.
- The Issue: A massive, broad storm (like Sandy or Katrina) pushes a much larger “mound” of water than a tiny, intense storm (like Andrew), even if the smaller storm has higher wind speeds.
2. Proposed Alternatives and Supplements
Scientists have developed several alternative indices to provide a more holistic view of a storm’s “true” power.
A. Integrated Kinetic Energy (IKE)
IKE is often cited by meteorologists as the most physically accurate measure of a storm’s destructive potential.
- How it works: Instead of looking at one point of max wind, IKE integrates (sums up) the kinetic energy of the entire wind field.
- Why it’s better: It accounts for both intensity and size. It explains why a massive Category 2 can be more destructive than a tiny Category 4.
B. Hurricane Severity Index (HSI)
Developed by private weather firms (like StormGeo), this is a 50-point scale.
- Structure: 25 points are awarded for Intensity (wind speed) and 25 points for Size (radius of winds).
- Advantage: It differentiates between “small/intense” and “large/broad” storms, providing a clearer picture for coastal infrastructure and shipping.
C. Tropical Cyclone Severity Scale (TCSS)
This is a newer proposal (discussed heavily in 2025-2026) that creates a composite score.
- The Formula: It combines Wind (W), Rainfall (R), and Surge (S) into a single multi-digit alert (e.g., a “4-5-2” storm).
- Behavioral Impact: Research shows that people are significantly more likely to evacuate for a “Rainfall Category 5” even if the “Wind Category” is low.
3. Comparison of Scale Capabilities
| Metric | Saffir-Simpson | IKE | TCSS (Proposed) |
| Max Winds | Yes | Yes | Yes |
| Storm Size | No | Yes | Yes |
| Rainfall / Flooding | No | No | Yes |
| Storm Surge | No | Partially | Yes |
| Ease of Use | High (1-5) | Low (Complex Math) | Medium (Composite) |
Why hasn’t the scale changed?
The primary hurdle is simplicity. Emergency managers fear that moving away from the “1-to-5” system will confuse the public during a crisis. As a compromise, organizations like Environment and Climate Change Canada and the NHC have started keeping the Saffir-Simpson numbers but “wrapping” them in impact-based colour codes (Yellow/Orange/Red) to explain the specific water and surge risks.
How is the storm investigated?
Investigating a hurricane requires a multi-layered approach that transitions from “space-eye” views down to physical sensors dropped directly into the eyewall. Because these storms are too large and dangerous for simple ground stations, meteorologists use a “Global Observing System” to gather data.
1. Remote Sensing (Satellite Imagery)
Satellites are the first line of defense, providing constant coverage of the data-sparse open ocean.
- Geostationary Satellites (GOES): These orbit at the same speed as Earth’s rotation, hovering over one spot. they provide high-resolution infrared and visible imagery every 30 seconds to track the storm’s “cloud top” temperatures and organization.
- Microwave Imagers: Unlike standard cameras, microwave sensors can “see through” the thick clouds of a hurricane to map the underlying rain structure and identify the formation of an eye before it’s visible.
- The Dvorak Technique: This is a subjective method where experts compare satellite cloud patterns to a library of known storm structures to estimate the storm’s current intensity (central pressure and wind speed).
2. In-Situ Data (Hurricane Hunters)
When a storm threatens land, the “Hurricane Hunters” (NOAA and U.S. Air Force) fly specially reinforced aircraft—like the WP-3D Orion or WC-130J—directly into the storm.
- The Flight Path: They fly “alpha patterns” (an X-shape) through the eye of the storm to find the exact center and minimum pressure.
- Dropsondes: These are small GPS-equipped sensor packages dropped from the plane. As they fall to the ocean, they transmit real-time data on temperature, humidity, pressure, and wind speed every few meters.
- Stepped Frequency Microwave Radiometer (SFMR): Nicknamed “Smurf,” this sensor mounted on the plane’s wing measures radiation emitted by the foam on the ocean surface to calculate surface wind speeds without ever touching the water.

3. Surface and Sub-Surface Sensors
To understand the “fuel” of the storm, we have to look below the waves.
- Moored Buoys: These floating stations measure sea surface temperatures (SST) and wave heights. If the temperature drops after a storm passes, it indicates “upwelling.”
- Argo Floats: These robotic devices dive deep into the ocean (up to 2,000 meters) to measure the Ocean Heat Content, telling us if there is enough deep warm water to sustain rapid intensification.
- Saildrones: Unmanned, solar-powered ocean surface vehicles that can be steered remotely into the heart of a category 5 hurricane to collect data that would be too risky for a manned ship.
4. Land-Based Radar
Once a hurricane is within 300–400 km of the coast, land-based Doppler Radar (NEXRAD) takes over.
- Velocity Mapping: Radar can measure the speed of raindrops moving toward or away from the station, providing a high-definition map of the wind field.
- Dual-Polarization: This helps meteorologists distinguish between heavy rain, debris, and even tornadoes forming within the rainbands.
Summary of Investigation Tools
| Tool | What it Measures | Why it Matters |
| Satellite | Cloud tops, organization | Early detection over open ocean. |
| Dropsonde | Vertical atmospheric profile | Provides “ground truth” for computer models. |
| SFMR (Smurf) | Surface wind speed | Determines the storm’s category. |
| Saildrone/Buoys | Ocean temperature/waves | Measures the “fuel” supply. |
How do hurricanes move?
The movement of a hurricane is often compared to a leaf drifting in a stream. While the storm generates its own powerful internal winds, its overall path (the “track”) is dictated by much larger, planet-scale atmospheric currents.
A hurricane’s movement is the result of three primary forces: Large-Scale Steering, the Beta Effect, and Internal Dynamics.
1. Large-Scale Steering (The “Stream”)
The most dominant force moving a hurricane is the surrounding wind field, specifically in the middle to upper troposphere (about 5 to 10 km up).
- Trade Winds: In the tropics, the Easterly Trade Winds push storms from east to west (e.g., from the coast of Africa toward the Caribbean).
- Subtropical Highs: Massive high-pressure systems, like the Bermuda High in the Atlantic, act as “boulders” in the stream. Hurricanes must flow around the edges of these Highs. If the Bermuda High is strong and extends west, it can “shove” a hurricane into the Gulf of Mexico.
- The Westerlies: As a storm moves further north, it encounters the Westerlies and the Jet Stream. These powerful winds catch the storm and “recurve” it toward the northeast, pulling it away from the tropics and out into the open North Atlantic.
2. The Beta Effect (The Natural “Nudge”)
Even if there were no steering winds at all, a hurricane would still move. This is due to the Beta Effect, which is caused by the Earth’s rotation and the change in the Coriolis Force with latitude.
- The Northward Drift: Because the Coriolis force is stronger on the side of the storm further from the equator, the storm’s own rotation creates a subtle secondary flow.
- The Result: In the Northern Hemisphere, this effect creates a natural “nudge” that pushes hurricanes north and west, even without external wind steering.
3. The Fujiwhara Effect (Interaction)
When two tropical cyclones come within about 1,400 km (870 miles) of each other, they begin to influence each other’s movement.
- The Dance: The two storms will begin to “orbit” around a common center between them.
- The Outcome: Often, the larger storm will “absorb” the smaller one, or they will simply slingshot each other in unexpected directions, making their paths very difficult to predict.
4. Predicting the Path: “Spaghetti Plots”
Because these steering forces are constantly changing, meteorologists use supercomputers to run multiple “ensemble” models.
- The “Spaghetti” Lines: Each line represents a slightly different starting condition (e.g., a slightly warmer ocean or a slightly weaker High-pressure system).
- The Cone of Uncertainty: When all the “spaghetti” lines agree, confidence is high. When they spread out, the “Cone of Uncertainty” widens, indicating that the steering currents are complex or shifting.
Summary of Movement Drivers
| Driver | Direction Influence | Analogy |
| Trade Winds | East to West | The conveyor belt. |
| Subtropical Highs | Around the edges | The boulder in the stream. |
| Jet Stream | West to East (Recurvature) | The highway exit ramp. |
| Beta Effect | Northward nudge | The internal compass. |
How do hurricanes compare with middle-latitude storms?
While both are powerful low-pressure systems that produce strong winds and heavy rain, hurricanes and middle-latitude storms (extratropical cyclones) are driven by entirely different physical mechanisms.
The fundamental difference lies in their energy source: hurricanes are fueled by the release of latent heat from warm water, while middle-latitude storms are fueled by the horizontal temperature contrasts between air masses.
1. Energy Source and Core Temperature
- Hurricanes (Warm Core): These are “warm-core” systems. The center of the storm is warmer than the surrounding air. This warmth is maintained by the condensation of water vapor rising from the tropical ocean.
- Middle-Latitude Storms (Cold Core): These are “cold-core” systems. They thrive on the temperature gradient between cold polar air and warm tropical air. The center of the storm at high altitudes is typically colder than the surrounding air.
2. Physical Structure and Fronts
- Hurricanes: These systems are symmetric and do not have fronts. The strongest winds are found near the center (the eyewall) and decrease as you move outward.
- Middle-Latitude Storms: These are asymmetric and defined by fronts (cold, warm, and occluded). The strongest winds are often found high in the atmosphere within the Jet Stream and spread out over a much larger area at the surface.
3. Size and Scale
- Hurricanes: Typically smaller and more compact, usually ranging from 100 to 500 km in diameter. However, their winds are much more concentrated and intense near the center.
- Middle-Latitude Storms: These can be massive, often stretching 1,000 to 4,000 km across. While their peak winds are usually lower than a major hurricane, they impact a much larger geographic area simultaneously.
4. Vertical Air Motion
- Hurricanes: Air sinks in the very center (the eye), creating a calm “void.”
- Middle-Latitude Storms: Air generally rises throughout the entire center of the low-pressure area; they do not have a calm “eye.”
Comparison Summary Table
| Feature | Hurricane (Tropical) | Middle-Latitude Storm |
| Primary Fuel | Latent heat (Warm Water) | Temperature gradients (Fronts) |
| Thermal Core | Warm Core | Cold Core |
| Fronts | None | Cold, Warm, and Occluded |
| Strongest Winds | Surface (Eyewall) | Upper Atmosphere (Jet Stream) |
| Size | Compact (Smaller) | Expansive (Larger) |
| Season | Late Summer / Fall | Winter / Spring |
Can one turn into the other?
Yes. This is called Extratropical Transition. When a hurricane moves into the colder waters of the North Atlantic, it loses its warm-core tropical characteristics and begins to interact with the Jet Stream and cold fronts. It expands in size, its eye disappears, and it transforms into a powerful middle-latitude storm.
This is frequently how post-tropical storms impact places like Atlantic Canada or the United Kingdom.
How are hurricanes and tropical storms named?
The naming of hurricanes and tropical storms is a highly organized, international process managed by the World Meteorological Organization (WMO). The goal is to provide a clear, easy-to-remember shorthand for communication between forecasters, emergency managers, and the public.
1. When is a Name Assigned?
A system is not named as soon as it forms. It must reach a specific level of organization and strength:
- Tropical Depression: Assigned a number (e.g., Tropical Depression 05).
- Tropical Storm: Once sustained winds reach 63 km/h (39 mph), it is assigned a name from the pre-determined list.
- Hurricane: The storm keeps the name it was given as a Tropical Storm as it intensifies.
2. The List Rotation
The WMO maintains six separate lists of names for the Atlantic and Eastern North Pacific regions.
- Six-Year Cycle: These lists rotate every six years. For example, the list of names used in 2024 will be used again in 2030.
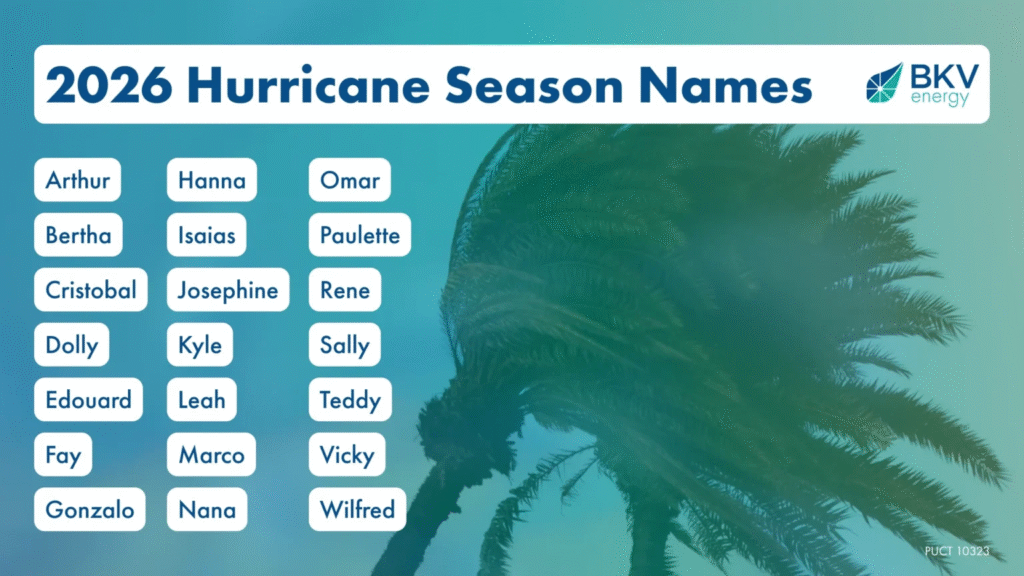
- Alphabetical Order: Names are arranged alphabetically, alternating between masculine and feminine names.
- Excluded Letters: In the Atlantic, the letters Q, U, X, Y, and Z are not used because there aren’t enough easily recognizable names starting with those letters.
3. Retiring Names
If a storm is particularly deadly or costly, using its name in the future would be considered insensitive or confusing for historical records.
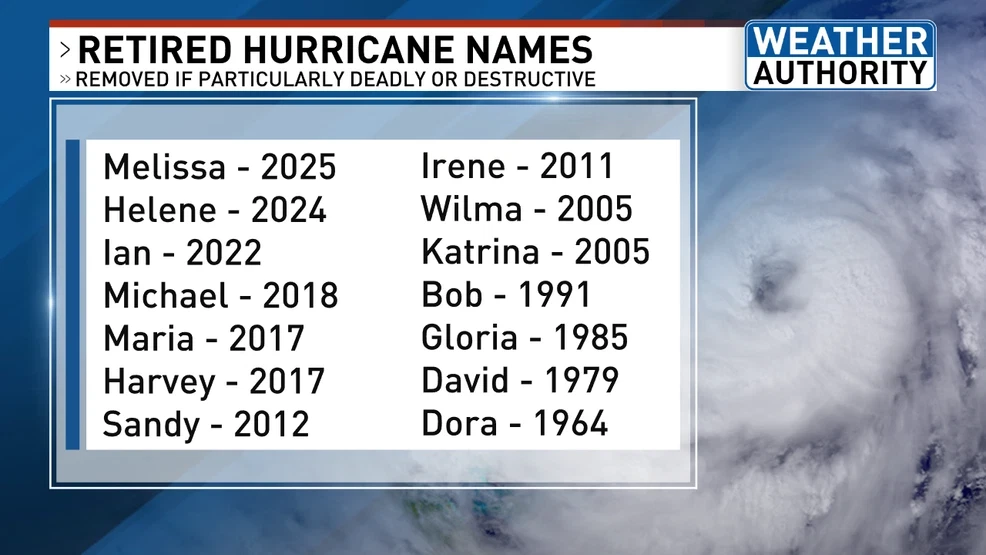
- The Retirement Process: At the annual meeting of the WMO Tropical Cyclone Committee, members vote to “retire” specific names.
- Replacement: A new name starting with the same letter is chosen to replace the retired one. For example, Katrina (2005) was replaced by Katia, and Ian (2022) was replaced by Idris.
4. What Happens if the List Runs Out?
In years with extremely high activity, a list might run out of names before the season ends.
- The Old Way: Previously, meteorologists used the Greek Alphabet (Alpha, Beta, Gamma, etc.).
- The New Way: Starting in 2021, the WMO created a Supplemental List of standard names to be used if the primary list is exhausted. This avoids the confusion that occurred during the record-breaking 2020 season.
5. Regional Differences
While the Atlantic uses names like Helene or Milton, other parts of the world use different systems based on local culture:
- Western Pacific: Names are often contributed by 14 different countries and include names of flowers, animals, or even foods (e.g., Typhoon Damrey, which means “elephant” in Khmer).
- Northern Indian Ocean: Names are chosen sequentially from a list provided by member nations like India, Oman, and Thailand.

Do scientists see any shortcomings with the current naming system and are there any alternatives?
While the current naming system by the World Meteorological Organization (WMO) is a significant improvement over the days when storms were identified only by latitude and longitude, many scientists and communication experts argue it still has several functional shortcomings.
The primary debate centers on how names affect public perception of risk.
1. Identified Shortcomings
The “Gender Bias” in Risk Perception
A controversial 2014 study published in PNAS suggested that people perceive “feminine” names as less threatening than “masculine” ones.
- The Concern: If a storm is named “Hanna” instead of “Harvey,” the public might take fewer precautions, potentially leading to higher fatality rates.
- Scientific Debate: Many meteorologists dispute this, arguing that the study didn’t account for improvements in forecasting and building codes over time, but it sparked a massive conversation about how names influence psychology.
Linguistic and Cultural Barriers
The Atlantic list is used for storms affecting the Caribbean, Central America, and North America.
- Pronunciation: Names that are easy for English speakers to pronounce might be difficult for Spanish or French speakers in the same region, and vice versa.
- Confusion: If a name is difficult to communicate over radio or in loud environments, critical warnings can be misunderstood.
Retirement Fatigue
The process of retiring names is reactive, not proactive.
- Historical Weight: Some scientists argue that keeping names like “Katrina” or “Ian” out of the rotation is helpful, but the constant need for new, recognizable names is becoming a logistical challenge as high-activity seasons become more frequent.
2. Proposed Alternatives
Several alternatives have been proposed to address these communication gaps:
The “Sponsor” or “Monetized” Model
While mostly dismissed by the scientific community, some have joked about “selling” storm names to corporations (e.g., Hurricane Pepsi) to fund climate research or disaster relief.
- Why it’s rejected: It risks trivializing life-threatening events and could lead to legal nightmares regarding “brand damage” if a storm causes catastrophic loss.
Impact-Based Labeling (The “Color-Coded” System)
Instead of a human name, some experts suggest a system similar to air quality or fire risk.
- The System: Storms would be assigned a name PLUS a color or level (e.g., Storm Red-5).
- The Goal: This moves the focus away from a personified name and directly onto the expected impact (flooding, wind, or surge).
Numeric-Year Coding
A more clinical approach would be using a combination of the year and the order of occurrence (e.g., 2026-Alpha-04).
- The Benefit: It is perfectly objective and avoids any gender or cultural bias.
- The Downside: Scientists acknowledge that numbers are much harder for the general public to remember and “bond” with in terms of tracking a specific threat.
Enhanced Geographic Naming
Some argue for naming storms after their point of origin or the specific water body they formed in.
- The Goal: This provides immediate geographical context to the listener, though it becomes confusing if multiple storms form in the same area.
3. The “Greek Alphabet” Problem (Already Solved)
Scientists long complained that using the Greek Alphabet (Alpha, Beta, etc.) when the standard list ran out was a major shortcoming.
- The Issue: The names sounded too similar, and “Zeta” or “Eta” didn’t convey the same “personality” or danger as a standard name.
- The Fix: In 2021, the WMO officially replaced the Greek alphabet with a Supplemental Name List of regular names, directly addressing this scientific critique.
What was hurricane Juan and when did it strike Halifax?
Hurricane Juan was one of the most significant and damaging weather events in modern Canadian history. It is remembered primarily for its unusual strength upon landfall in a region where hurricanes typically weaken significantly before arrival.
When and Where It Struck
Hurricane Juan made landfall on the coast of Nova Scotia at 12:10 a.m. ADT on Monday, September 29, 2003.
The center of the storm came ashore between Shad Bay and Prospect, just west of Halifax. Because the strongest winds of a hurricane are located in the eastern eyewall, the Halifax Regional Municipality (HRM) bore the direct brunt of the storm’s peak intensity.
Key Characteristics of the Storm
Juan was a Category 2 hurricane at landfall, which is exceptionally rare for Nova Scotia. Typically, storms reaching this latitude have moved over much colder water and weakened to Category 1 or “post-tropical” status.
- Maximum Sustained Winds: Measured at 158 km/h (98 mph) at landfall.
- Peak Wind Gusts: A record gust of 176 km/h was recorded at McNabs Island in Halifax Harbour before the sensor failed; some unofficial estimates elsewhere suggested gusts exceeding 230 km/h.
- The “Heat” Factor: Juan remained strong because ocean temperatures south of Nova Scotia were roughly 3°C warmer than usual that year, acting as high-octane fuel that prevented the storm from spinning down as it moved north.
Major Impacts on Halifax
The damage to Halifax was catastrophic and changed the city’s landscape for a generation:
- Forestry & Parks: The city lost over 100 million trees across the province. In Halifax, the beloved Point Pleasant Park lost nearly 75% of its trees, and the Public Gardens suffered massive damage.
- Storm Surge: Juan produced a record storm surge of 1.5 to 2.1 meters in Halifax Harbour. This resulted in the highest water level ever recorded in the city (2.9 meters above chart datum), flooding the downtown waterfront and throwing boulders the size of trash cans onto the boardwalks.
- Power Outages: The combination of hurricane-force winds and falling trees decimated the electrical grid. More than 300,000 people lost power, with some residents waiting up to two weeks for restoration.
- Casualties: The storm was directly or indirectly responsible for 8 deaths in Canada.
Why it was a “Wake-Up Call”
Before Juan, there was a sense of “hurricane complacency” in Atlantic Canada, as many believed the cold waters of the North Atlantic acted as a permanent shield. Juan proved that under the right conditions, a major hurricane could maintain its structural integrity all the way to the coast. Due to its impact, the name Juan was retired by the World Meteorological Organization in 2004—the first time a name was retired at the request of the Meteorological Service of Canada.
What are winds, flooding, and storm surges?
While these three hazards are often grouped together during a hurricane, they are distinct physical processes caused by different forces within the storm’s anatomy.
1. Winds: The Kinetic Energy
Hurricane winds are the result of a massive pressure gradient. Because the air pressure in the eye is extremely low, the higher-pressure air from the surrounding atmosphere rushes toward the center at incredible speeds.
- Sustained Winds: These are the average wind speeds measured over a 1-minute interval. This is what determines a hurricane’s Category (1–5) on the Saffir-Simpson Scale.
- Gusts: Brief, high-speed bursts of wind that can be 20–30% stronger than sustained winds. These are often what cause structural failure in buildings.
- The Right-Front Quadrant: In the Northern Hemisphere, the strongest winds are found on the right side of the storm’s path because the storm’s forward motion adds to its internal wind speed.
2. Storm Surge: The Ocean’s “Bulge”
Storm surge is often the deadliest part of a hurricane. It is a literal rise in sea level caused by the storm pushing water toward the shore.
- Wind Stress: As the hurricane’s winds blow over the ocean surface, they “pile up” water ahead of the storm.
- Pressure Effect: The extremely low pressure in the eye acts like a vacuum, slightly “lifting” the ocean surface, though wind stress accounts for about 95% of the total surge.
- The “Wall of Water”: When this mound of water hits the shallow coastline, it has nowhere to go but inland. It isn’t a single wave like a tsunami; it is a rapid, relentless rise in water that can reach heights of over 6 meters (20 feet).
3. Flooding: Freshwater Accumulation
While storm surge is saltwater from the ocean, flooding (or “pluvial/fluvial” flooding) refers to the accumulation of freshwater from extreme rainfall.
- Rainfall Rates: Hurricanes can drop 150–300 mm (6–12 inches) of rain in just a few hours. If a storm moves slowly or “stalls,” these totals can double.
- Inland Reach: Unlike storm surge, which stays near the coast, freshwater flooding can happen hundreds of kilometers inland, overflowing rivers and overwhelmed drainage systems.
- Flash Floods: Intense rain in mountainous areas can cause “debris flows” or mudslides, which move with enough force to sweep away vehicles and homes.
Comparison of Hazards
| Hazard | Source | Primary Cause | Main Danger |
| Winds | Atmosphere | Pressure Gradient | Projectiles, structural collapse, downed trees. |
| Storm Surge | Ocean | Wind Stress + Low Pressure | Drowning, coastal erosion, building foundation failure. |
| Flooding | Rain | Latent Heat / Condensation | Inland drowning, road washouts, contaminated water. |
Why They Often Combine
A landfalling hurricane usually brings all three at once. For example, during Hurricane Juan in Halifax, the record storm surge (saltwater) flooded the waterfront, while the winds (kinetic energy) knocked down millions of trees, and heavy rain (freshwater) caused localized flooding.
How many fatalities are a direct result of hurricanes?
The number of fatalities directly resulting from hurricanes varies wildly from year to year, depending on the storm’s intensity, the population density of the landfall area, and the effectiveness of evacuation orders.
Historically, the causes of death have shifted significantly. In the early 20th century, thousands could die in a single event; today, while property damage has soared, better forecasting has generally (though not always) reduced the death toll in developed nations.
1. The “Big Picture” Statistics
- Global Average: On a global scale, tropical cyclones (including hurricanes, typhoons, and cyclones) are responsible for an average of 10,000 to 15,000 deaths annually.
- The Atlantic Basin: In the United States and the Caribbean, the average is much lower due to advanced warning systems, typically ranging from 50 to 100 direct fatalities per year, though “outlier” years like 2005 (Katrina) or 2017 (Maria) can see numbers climb into the thousands.
2. Primary Causes of Direct Fatalities
Data from the National Hurricane Center (NHC) shows a clear “deadliest” hazard. Water, not wind, is the primary killer.
- Storm Surge (Nearly 50%): Drowning due to the massive “wall of water” pushed ashore is historically the leading cause of death.
- Rain-Induced Flooding (Approx. 25-27%): Freshwater flooding from extreme rainfall often kills people inland, far from the coastal surge, frequently involving vehicles trapped in rising water.
- Surf/Rip Currents (Approx. 5-10%): These deaths often occur before or after the storm makes landfall, affecting swimmers or people on piers far from the center.
- Wind-Related (Approx. 8%): Direct deaths from wind usually involve structural collapses or being struck by flying debris (projectiles).
- Tornadoes (Approx. 3%): Embedded tornadoes within rainbands cause a small but lethal percentage of direct fatalities.
3. Historical Extremes
To put the numbers in perspective, individual storms have defined entire eras of emergency management:
| Storm | Year | Region | Estimated Fatalities | Primary Cause |
| Great Galveston Hurricane | 1900 | Texas, USA | 6,000 – 12,000 | Storm Surge |
| Bhola Cyclone | 1970 | Bangladesh | 300,000 – 500,000 | Storm Surge/Flooding |
| Hurricane Mitch | 1998 | Central America | 11,000+ | Mudslides/Flooding |
| Hurricane Katrina | 2005 | Gulf Coast, USA | 1,200 – 1,800 | Levee Failure/Surge |
| Hurricane Maria | 2017 | Puerto Rico | 2,975 (Est.) | Infrastructure Collapse* |
Note on “Direct” vs. “Indirect” Deaths: Meteorologists distinguish between direct deaths (drowning in surge, hit by a falling tree) and indirect deaths (heart attacks during cleanup, carbon monoxide poisoning from generators, or lack of medical care due to power outages). In recent decades, indirect deaths often outnumber direct deaths in the days following a storm.
4. Why Fatalities Are Changing
- Better Tracking: We now have 3–5 days of “lead time,” allowing for massive evacuations that save thousands of lives.
- Infrastructure Failure: As seen with Hurricane Katrina or Maria, the death toll rises exponentially when secondary systems—like levees, power grids, or hospitals—fail after the winds stop.
- Population Growth: More people living in “Vulnerable Zones” (low-lying coastal areas) means that even a weak storm can potentially cause more fatalities than a stronger storm 50 years ago.
What are notable hurricanes?
Throughout history, certain hurricanes have become “notable” not just for their wind speeds, but for how they fundamentally changed meteorology, engineering, or human history. These storms are often categorized by the specific type of impact they had.
1. The Deadliest: The Great Galveston Hurricane (1900)
To this day, the 1900 hurricane that struck Galveston, Texas, remains the deadliest natural disaster in United States history.
- Impact: An estimated 6,000 to 12,000 people lost their lives.
- Why it’s notable: At the time, Galveston was a booming “Jewel of the South.” The storm’s 4.5-meter (15-foot) storm surge completely overwhelmed the low-lying island.
- The Legacy: Following the tragedy, the city built a massive concrete seawall and physically raised the grade of the entire city by several feet—a monumental feat of civil engineering.
2. The Costliest & Systemic Failure: Hurricane Katrina (2005)
Katrina is rarely remembered for its winds at landfall (it was a Category 3), but rather for the catastrophic failure of man-made infrastructure.
- Impact: It caused over $190 billion (USD) in damage and led to nearly 1,400 deaths.
- Why it’s notable: The storm surge caused the levee systems in New Orleans to fail, flooding 80% of the city. It highlighted deep-seated issues in emergency management and urban planning.
- The Legacy: It led to a complete overhaul of the Federal Emergency Management Agency (FEMA) and the construction of the $14 billion Greater New Orleans Hurricane & Storm Damage Risk Reduction System.
3. The Most Intense (Pressure): Hurricane Wilma (2005)
Wilma holds the record for the lowest central pressure ever recorded in the Atlantic basin.
- Intensity: Its central pressure dropped to 882 mbar (hPa).
- Why it’s notable: It underwent “explosive deepening,” with its pressure dropping 88 mbar in just 24 hours. This shattered the previous record held by Hurricane Gilbert (1988).
- The Legacy: Wilma serves as the primary case study for Rapid Intensification, a phenomenon meteorologists are still working to predict more accurately today.
4. The Hurricane that “Changed the North”: Hurricane Juan (2003)
For residents of Atlantic Canada, Juan is the benchmark for tropical destruction.
- Impact: It struck Halifax, Nova Scotia, as a strong Category 2.
- Why it’s notable: Most storms weaken significantly before reaching such high latitudes. Juan maintained its strength due to unusually warm ocean temperatures, catching the region off guard.
- The Legacy: It resulted in the first-ever retirement of a hurricane name based on a request from the Meteorological Service of Canada.
5. The Largest Wind Field: Hurricane Sandy (2012)
While technically “Post-Tropical” at landfall, Sandy was notable for its sheer physical size.
- Dimensions: At its peak, Sandy’s tropical-storm-force winds spanned over 1,800 km (1,100 miles).
- Why it’s notable: Because it was so large, it pushed a massive volume of water into New York Harbor and the New Jersey coast, flooding the NYC subway system and causing widespread power outages in the most densely populated region of the U.S.
- The Legacy: It forced a re-evaluation of “Post-Tropical” warnings, ensuring that even if a storm loses its “hurricane” status, the dangers of surge and wind remain a priority for alerts.
Comparison of Notable Storms
| Storm | Notable For | Key Metric |
| Galveston (1900) | Deadliest | 6,000–12,000 Deaths |
| Labor Day (1935) | Strongest Landfall (US) | 295 km/h Winds |
| Camille (1969) | Absolute Wind Velocity | Category 5 Landfall |
| Mitch (1998) | Rainfall/Mudslides | 11,000+ Deaths (Central Am.) |
| Katrina (2005) | Economic Damage | $190+ Billion |
| Patricia (2015) | Strongest Winds (Global) | 345 km/h (Pacific) |
What was hurricane Camille, 1969?
Hurricane Camille is regarded by meteorologists as one of the most intense tropical cyclones to ever strike the United States. It is one of only four hurricanes in recorded history to make landfall in the U.S. as a Category 5 on the Saffir-Simpson Scale.
1. Intensity and Landfall
Camille struck the Mississippi Gulf Coast near Waveland and Pass Christian on the night of August 17, 1969.
- Extreme Winds: Because the storm destroyed nearly all anemometers (wind-measuring devices) in its path, its true wind speed was a matter of debate for decades. Re-analysis suggests sustained winds were approximately 280 km/h (175 mph) at landfall, with gusts exceeding 305 km/h (190 mph).
- Low Pressure: Its central pressure at landfall was 900 mbar (hPa), which at the time was the second-lowest ever recorded in the U.S. (surpassed only by the 1935 Labor Day Hurricane).
2. The Storm Surge
Camille produced a catastrophic storm surge that redefined coastal vulnerability.
- Record Height: A surge of 7.5 meters (24.6 feet) was measured in Pass Christian, Mississippi. This remained the record for the highest storm surge in U.S. history until Hurricane Katrina in 2005.
- Total Destruction: The surge was so powerful that it completely leveled three-story brick buildings and swept away entire neighborhoods, leaving only concrete slabs behind.
3. The Virginia Flooding (The “Inland Surprise”)
While Camille is famous for its coastal impact, it is equally notable for what it did as a weakening tropical depression over Virginia.
- Orographic Lift: As the remnants of Camille hit the Blue Ridge Mountains, the moisture was forced upward rapidly.
- Extreme Rainfall: In just 8 hours, parts of Nelson County, Virginia, received over 680 mm (27 inches) of rain.
- Result: This triggered massive flash floods and mudslides that claimed 153 lives in Virginia alone—over half of the storm’s total death toll.
4. Why Camille is Historically Significant
- The Saffir-Simpson Scale: Camille was the catalyst for the creation of the Category 1–5 scale. Emergency managers realized that simply telling the public the “central pressure” wasn’t enough to convey the potential for destruction.
- The “Richelieu Apartments” Legend: A famous (though largely debunked) story emerged of a “hurricane party” at these apartments where everyone supposedly died. While the party likely didn’t happen as described, the building was completely destroyed, and many residents who stayed did perish, serving as a grim warning for future evacuations.
- Evacuation Orders: Camille led to much more aggressive evacuation protocols. The sheer level of “complete destruction” seen in Mississippi proved that some structures simply cannot be stayed in during a Category 5 event.
Summary of Camille’s Impact
| Metric | Measurement |
| Max Sustained Winds | 280 km/h (175 mph) |
| Lowest Pressure | 900 mbar |
| Highest Storm Surge | 7.5 meters |
| Total Fatalities | 259 |
| Damage (1969 USD) | $1.42 Billion |
What was hurricane Tip, 1979?
Typhoon Tip (referred to as a hurricane in the Atlantic/Eastern Pacific context) remains the gold standard for meteorological extremes. In 1979, it became the largest and most intense tropical cyclone ever recorded in Earth’s history.
While Hurricane Wilma (2005) holds the record for the Atlantic, Tip holds the global title for the lowest sea-level pressure.
1. Record-Breaking Intensity
On October 12, 1979, Tip reached its peak intensity in the Western Pacific.
- Minimum Central Pressure: 870 mbar (hPa). This is the lowest sea-level pressure ever measured on Earth.
- Maximum Sustained Winds: 305 km/h (190 mph), with higher gusts.
- Rapid Deepening: Tip intensified from a Tropical Storm to a Category 5-equivalent Super Typhoon in just over two days, fueled by exceptionally warm sea surface temperatures and perfect upper-level outflow.
2. Record-Breaking Size
Beyond its intensity, Tip was physically massive. It holds the record for the largest tropical cyclone ever observed.
- Diameter of Circulation: Approximately 2,220 km (1,380 miles).
- Visual Scale: If Typhoon Tip had been placed over the United States, it would have stretched from New York City to Houston, covering nearly half of the continental U.S.
- The “Eye”: Despite its massive overall size, the eye was relatively standard at 15 km in diameter, though the surrounding cloud shield was enormous.
3. Impact and Landfall
Tip eventually weakened before making landfall, but it still caused significant destruction in Japan.
- Landfall: It struck the island of Honshu, Japan, on October 19, 1979, as a weakened Category 1-equivalent storm.
- Flooding: Despite its weakened winds, Tip’s massive size brought incredible amounts of moisture. It triggered over 600 mudslides and flooded 22,000 homes.
- Casualties: The storm was responsible for 86 deaths. One of the most notable tragedies occurred at Camp Fuji, where a fuel storage fire triggered by the storm’s winds killed 13 U.S. Marines.
4. Why Tip is Historically Unique
- The Benchmark: In meteorology, Tip is the “ceiling.” Every major storm since 1979, including Typhoon Haiyan (2013) and Hurricane Patricia (2015), is compared to Tip to see if its pressure record will finally be broken.
- The Observation: Tip’s record pressure was confirmed by direct measurement. A U.S. Air Force reconnaissance aircraft flew into the eye and deployed a dropsonde, which recorded the 870 mbar reading—a feat of data collection that remains undisputed.
Summary of Typhoon Tip (1979)
| Metric | Measurement | Record Status |
| Lowest Pressure | 870 mbar (hPa) | World Record |
| Diameter | 2,220 km | World Record |
| Max Winds | 305 km/h (190 mph) | Top Tier |
| Landfall Location | Honshu, Japan | N/A |
What was hurricane Andrew, 1992?
Hurricane Andrew was a defining moment in modern meteorology and emergency management. For 13 years, it held the record as the costliest hurricane in U.S. history until it was surpassed by Katrina in 2005.
1. Intensity and Landfall
Andrew struck South Florida on August 24, 1992. It was a remarkably “tight” and fast-moving storm, which concentrated its destructive power into a relatively narrow path.
- Category 5 Status: Originally classified as a Category 4, a 10-year re-analysis by the National Hurricane Center in 2002 upgraded Andrew to a Category 5 at landfall.
- Winds: Sustained winds were estimated at 265 km/h (165 mph), with gusts measured at over 280 km/h (174 mph) before the instruments were destroyed.
- Pressure: Its central pressure at landfall was 922 mbar, making it one of the most intense storms to strike the U.S. mainland.
2. The Destruction of Homestead
While the entire Miami-Dade area felt the storm, the city of Homestead, Florida, was nearly erased.
- “Scoured” Earth: The winds were so intense they didn’t just peel roofs off; they pulverized entire wood-frame homes into splinters.
- The Homestead Air Force Base: The base was so severely damaged that it was closed and later rebuilt on a much smaller scale.
- Infrastructure Collapse: Andrew destroyed over 63,000 homes and damaged another 110,000. It left 175,000 people homeless overnight.
3. Why Andrew Changed Everything
Andrew is considered a “benchmark” storm because it exposed massive flaws in how the U.S. prepared for disasters.
- Building Code Overhaul: Investigators found that many homes destroyed by Andrew failed because of poor construction and “stapled” roofing. This led to the creation of the Florida Building Code, currently one of the strictest in the world regarding wind resistance and impact-resistant glass.
- The Insurance Crisis: The sheer scale of the payouts (approx. $27 billion in 1992 dollars) caused 11 insurance companies to go bankrupt. This forced the state of Florida to create “last resort” insurance pools to keep the housing market stable.
- Emergency Management Reform: The slow initial federal response to Andrew (“Where the hell is the cavalry?” famously asked a local official) led to a massive reorganization of FEMA, shifting it toward a more proactive, military-style response for future catastrophes.
4. Summary of Andrew’s Impact
| Metric | Measurement |
| Max Sustained Winds | 265 km/h (165 mph) |
| Lowest Pressure | 922 mbar |
| Direct Fatalities | 26 |
| Total Damage | ~$27.3 Billion (1992 USD) |
Andrew eventually crossed the Gulf of Mexico and made a second landfall in Louisiana as a Category 3 storm, causing further significant damage and flooding.
What was hurricane Katrina, 2005?
Hurricane Katrina is considered the most significant natural disaster in modern United States history, not just for its meteorological intensity, but for the catastrophic failure of man-made engineering and emergency response systems that followed.
1. Meteorological Life Cycle
Katrina formed as a tropical depression over the Bahamas on August 23, 2005.
- Rapid Intensification: After crossing Florida as a Category 1, it moved over the Loop Current in the Gulf of Mexico—a deep pool of exceptionally warm water. This acted as high-octane fuel, causing the storm to explode into a massive Category 5 with winds of 280 km/h (175 mph).
- Landfall: By the time it struck the Gulf Coast near Buras, Louisiana, on August 29, 2005, it had weakened to a Category 3. However, its physical size was enormous, pushing a massive volume of water toward the shore.
2. The Infrastructure Failure
The defining characteristic of Katrina was not the wind, but the storm surge and the subsequent collapse of the levee system in New Orleans.
- The Surge: Katrina produced a record storm surge of nearly 8.5 meters (28 feet) in Mississippi, completely leveling coastal towns like Waveland and Gulfport.
- Levee Breaches: In New Orleans, the surge pushed water into industrial canals and Lake Pontchartrain. The city’s levee system, designed by the U.S. Army Corps of Engineers, failed in over 50 locations.
- Flooding: Because New Orleans is largely below sea level, the breached levees allowed water to pour into the city for days. Eventually, 80% of New Orleans was underwater, with depths reaching 6 meters (20 feet) in some neighborhoods.
3. Human and Economic Impact
Katrina remains one of the deadliest and most expensive storms in history.
- Fatalities: There were approximately 1,392 confirmed deaths, with many occurring in New Orleans due to drowning or the lack of medical care, food, and water in the days following the flood.
- Displacement: Over one million people were displaced from the Gulf Coast, creating the largest internal migration in the U.S. since the Dust Bowl of the 1930s.
- Economic Cost: The total damage is estimated at $190 billion (USD), making it the costliest hurricane in U.S. history.
4. Why Katrina Changed Everything
The aftermath of Katrina led to a fundamental shift in how the world views disaster preparedness:
- FEMA Reform: The slow and disorganized federal response led to the Post-Katrina Emergency Management Reform Act, which overhauled FEMA and gave it more autonomy and resources.
- Engineering Standards: The failure of the levees resulted in the construction of the $14.5 billion Hurricane & Storm Damage Risk Reduction System (HSDRRS), including the massive “Great Wall of Louisiana” (the Borgne Surge Barrier).
- Social Awareness: The storm exposed deep-seated issues regarding poverty and racial inequality, as those with the fewest resources were often the ones left behind during the evacuation.
Summary of Hurricane Katrina (2005)
| Metric | Measurement |
| Max Intensity (Gulf) | Category 5 (902 mbar) |
| Landfall Intensity | Category 3 (920 mbar) |
| Highest Storm Surge | 8.5 meters (28 feet) |
| Total Damage | ~$190 Billion |
| Status | Name Retired |
What was hurricane Sandy, 2012?
Hurricane Sandy, often referred to as “Superstorm Sandy,” was a massive and exceptionally destructive storm that struck the Atlantic coast of the United States and the Caribbean in late October 2012.
While it was technically a Category 3 hurricane at its peak in the Caribbean, its most notable characteristic was its unprecedented size and its unusual transition as it moved toward the U.S. Northeast.
1. Meteorological Evolution and Transition
Sandy was a unique “hybrid” storm. As it moved north from the Caribbean, it merged with a cold winter weather system coming from the west.
- Size: At its peak, Sandy’s tropical-storm-force winds spanned a staggering 1,850 km (1,150 miles) in diameter, making it the largest Atlantic hurricane on record by wind span.
- Extratropical Transition: Just before landfall, Sandy lost its “warm core” tropical characteristics and became a powerful Post-Tropical Cyclone. However, because of its massive size, it maintained hurricane-force winds and a devastating storm surge.
- The “Left Hook”: Most hurricanes at that latitude “recurve” out to sea. Sandy was blocked by a massive high-pressure system over Greenland (the “North Atlantic Blocking High”), which forced the storm to take a sharp, rare left turn directly into New Jersey and New York.
2. The Impact on New York and New Jersey
Because Sandy was so large, it pushed a massive volume of water into the funnel-shaped New York Bight.
- Record Storm Surge: A record surge of 4.3 meters (14 feet) was measured at The Battery in Lower Manhattan. This water topped the seawalls and poured into the city’s infrastructure.
- The Subway Flood: Seven subway tunnels under the East River were flooded, along with several commuter rail tunnels and the Brooklyn-Battery Tunnel. This was the most significant damage in the 108-year history of the NYC subway system.
- Power Outages: A massive explosion at a Con Edison substation on 14th Street plunged much of Lower Manhattan into darkness for nearly a week. In total, over 8 million people lost power across 17 states.
3. Human and Economic Cost
Sandy was the second-costliest hurricane in U.S. history at the time (now surpassed by Katrina, Harvey, and Ian).
- Fatalities: The storm was responsible for at least 233 deaths across eight countries, including 159 in the United States and 54 in the Caribbean (primarily Haiti and Cuba).
- Economic Damage: Total damage exceeded $70 billion (USD). In New Jersey and New York alone, over 650,000 homes were damaged or destroyed.
4. Why Sandy Changed Policy
Sandy served as a massive wake-up call for climate adaptation in highly populated urban areas:
- “Post-Tropical” Warnings: Because Sandy was no longer technically a “hurricane” at landfall, there was confusion over whether hurricane warnings should remain in effect. The National Weather Service changed its policies afterward to allow hurricane warnings to continue even if a storm changes its physical structure.
- Resiliency Planning: It led to the “Big U” and other multi-billion dollar coastal resiliency projects designed to protect Manhattan from future sea-level rise and storm surges.
- Grid Hardening: Utilities began “hardening” the electrical grid, moving critical components out of basements and flood zones to prevent the kind of widespread blackouts Sandy caused.
Summary of Hurricane Sandy (2012)
| Metric | Measurement |
| Max Intensity | Category 3 (Caribbean) |
| Diameter | 1,850 km (Largest on Record) |
| Peak Surge (NYC) | 4.3 meters (14 feet) |
| Total Damage | ~$70 Billion |
| Status | Name Retired |
Were there any other devastating hurricanes
While we’ve covered the “famous” names, several other hurricanes have fundamentally changed the countries they struck. Some were devastating because of their record-breaking rain, while others are remembered for the sheer speed at which they intensified.
1. Hurricane Mitch (1998) – The Rainfall Catastrophe
Mitch is one of the deadliest Atlantic hurricanes in history, not because of its wind, but because it “stalled” over Central America.
- The Impact: As the storm sat over the mountainous terrain of Honduras, Nicaragua, and Guatemala, it dropped up to 900 mm (35 inches) of rain in some areas.
- Devastation: This triggered massive mudslides and flash floods that buried entire villages. More than 11,000 people were confirmed dead, and an equal number were reported missing.
- Legacy: It remains a primary case study in how slow-moving storms in mountainous regions can be far more lethal than high-wind storms on flat coasts.
2. Hurricane Maria (2017) – The Infrastructure Collapse
Maria struck Puerto Rico as a high-end Category 4, just two weeks after the island had been grazed by Hurricane Irma.
- The Impact: The storm completely destroyed the island’s electrical grid and telecommunications. Many residents went months without power or clean water.
- The Controversy: While the “direct” death toll was initially reported as low, a subsequent Harvard study and government revision estimated that 2,975 people died due to the long-term collapse of the healthcare system and infrastructure.
- Legacy: Maria is the benchmark for how a hurricane can cause a “cascading failure” of modern society’s basic needs.
3. Hurricane Harvey (2017) – The Urban Flood
Harvey is notable for being the first Category 4 hurricane to make landfall in Texas since 1961, but its legacy is the unprecedented flooding of Houston.
- The Impact: Harvey “meandered” over Southeast Texas for days. It dropped a record-shattering 1,539 mm (60.58 inches) of rain in Nederland, Texas—the highest rainfall total ever recorded from a single tropical cyclone in the United States.
- Devastation: The storm caused over $125 billion in damage, primarily from home flooding in areas that were previously considered “low risk.”
- Legacy: It forced a global conversation about urban planning, “pavement sprawl,” and how cities handle extreme drainage.
4. Hurricane Ian (2022) – The Modern Surge
Ian was a massive, slow-moving Category 4 storm that devastated Southwest Florida, specifically Fort Myers Beach and Sanibel Island.
- The Impact: It produced a storm surge of nearly 4.5 meters (15 feet). Because the Florida coast is so flat, this water pushed miles inland, destroying thousands of homes that had survived previous storms.
- Devastation: With over $113 billion in damage, it became the third-costliest hurricane in U.S. history.
- Legacy: Ian highlighted the danger of “rapid intensification” just before landfall, leaving residents with very little time to change their evacuation plans.
5. Hurricane Irma (2017) – The Caribbean Powerhouse
Before hitting Florida, Irma was one of the strongest storms ever recorded in the open Atlantic.
- The Impact: It maintained sustained winds of 295 km/h (185 mph) for a record-breaking 37 consecutive hours.
- Devastation: It practically leveled the islands of Barbuda, Saint Martin, and the British Virgin Islands. Barbuda was declared “barely habitable” after 95% of its structures were damaged.
Summary of Other Major Storms
| Storm | Year | Primary Impact | Notable Metric |
| Mitch | 1998 | Mudslides/Rain | 11,000+ Deaths |
| Maria | 2017 | Grid Collapse | 2,975 Deaths |
| Harvey | 2017 | Urban Flooding | 1,539 mm of Rain |
| Irma | 2017 | Island Destruction | 295 km/h for 37 hours |
| Ian | 2022 | Storm Surge | $113 Billion Damage |
What are hurricane watches, warnings, and forecasts?
In the world of meteorology, the distinction between a “watch” and a “warning” is the difference between potential and imminent danger. These tools, along with numerical forecasts, form the backbone of public safety during a storm.
1. Hurricane Watch vs. Warning
The National Hurricane Center (NHC) and Environment Canada use these terms to signal how much time you have to prepare.
Hurricane Watch
A Hurricane Watch means that hurricane conditions (sustained winds of 119 km/h or higher) are possible within your area.
- Timing: Issued 48 hours before the anticipated onset of tropical-storm-force winds.
- Action: This is the time to fuel your vehicle, check your emergency kit, and ensure your “Social Deck” or outdoor furniture is secured.
Hurricane Warning
A Hurricane Warning means that hurricane conditions are expected within your area.
- Timing: Issued 36 hours before the anticipated onset of tropical-storm-force winds.
- Action: Preparations should be rushed to completion. If an evacuation order is given for your zone, you should leave immediately.
2. The Forecast “Cone of Uncertainty”
The most recognizable part of a hurricane forecast is the “Cone.” This graphic represents the probable track of the center of a tropical cyclone.
- The Center Line: This is the best estimate of where the center of the storm will go based on current computer models.
- The Cone: The cone represents the track forecast uncertainty. Historically, the entire track of the storm stays within the cone about 60-70% of the time.
- Common Misconception: People often think the cone shows the size of the storm or where the impacts will be. In reality, hazardous winds and rain often extend well outside the boundaries of the cone.
3. Types of Specialized Forecasts
Meteorologists use several different products to communicate specific risks beyond just the track:
Wind Speed Probabilities
These text and graphic products show the likelihood that a specific location will experience tropical-storm-force or hurricane-force winds. This is often more useful for local planning than the track alone.
Surface Pressure and Satellite Analysis
By looking at the central minimum pressure (measured in millibars or hPa), forecasters determine if a storm is strengthening. A rapidly falling pressure indicates “explosive deepening.”
Storm Surge Watches and Warnings
Because water is the leading cause of death, the NHC now issues specific Storm Surge Warnings. These are separate from wind warnings and highlight areas where life-threatening inundation from rising ocean water is expected.
4. How the Forecast is Made
Forecasts are generated using Numerical Weather Prediction (NWP) models.
- Global Models: Like the ECMWF (European) and GFS (American), which look at large-scale steering currents.
- HWRF (Hurricane Weather Research and Forecasting): A high-resolution model specifically designed to simulate the internal physics of a hurricane’s eyewall to predict intensity changes.
| Product | Lead Time | Primary Purpose |
| Tropical Outlook | 7 Days | Identifies areas where a storm might form. |
| Hurricane Watch | 48 Hours | Notifies that conditions are possible. |
| Hurricane Warning | 36 Hours | Warns that conditions are imminent. |
| Intermediate Advisory | 3 Hours | Provides updates on position and intensity between main advisories. |
How are hurricanes treated within the current colour code of Environment and Climate Change Canada?
As of late November 2025, Environment and Climate Change Canada (ECCC) officially transitioned to a new colour-coded weather alert system. This system aligns with World Meteorological Organization (WMO) standards and is designed to communicate the impact and confidence of a storm rather than just the weather type.
Under this system, hurricane-related alerts (issued by the Canadian Hurricane Centre) are now categorized into three distinct tiers: Yellow, Orange, and Red.
1. The Alert Colour Matrix
ECCC meteorologists use a matrix to determine the colour, crossing Forecast Confidence (Low to Very High) with Expected Impact (Moderate to Extreme).
| Colour | Risk Level | Expected Impacts |
| Yellow | Hazardous | Moderate, localized, or short-term disruption. (e.g., broken branches, minor power outages). |
| Orange | Severe | Major, widespread impacts lasting a few days. (e.g., widespread outages, roof damage). |
| Red | Extreme | Very dangerous, life-threatening, and prolonged. (e.g., structural collapse, destroyed parks). |
2. Application to Hurricanes
While standard “Watches” and “Warnings” still exist, they are now “wrapped” in these colours to tell you how bad the storm will actually be for your specific area.
- Yellow Warning – Tropical Storm: You might see this if a storm is expected to bring typical “blustery” coastal weather with localized issues.
- Orange Warning – Hurricane: This would likely be the standard for most landfalling hurricanes in Atlantic Canada, indicating significant property damage and utility failures.
- Red Warning – Hurricane: This is reserved for “rare and extreme” events. For example, ECCC has stated that a storm like Hurricane Fiona (2022) or Hurricane Juan (2003) would now be issued as a Red Warning due to the life-threatening storm surge and total infrastructure collapse.
3. Key Differences for 2026
- Impact-Based: The alert text now leads with what the weather will do (e.g., “Expected power outages for 48 hours”) rather than just what it is.
- Special Weather Statements: These remain Grey and are used for “information only” events that don’t yet meet the criteria for a coloured alert.
- Marine Exceptions: Note that Marine Weather Warnings (for those on the water) do not use this colour system; they continue to use the traditional single-tier warning program.
Summary Table: ECCC Hurricane Alerts
| Alert Type | Example Banner | When to Act |
| Watch | Yellow/Orange Watch | Prepare: Conditions are favorable; check your supplies. |
| Advisory | Yellow Advisory | Monitor: Significant weather is occurring but is less severe. |
| Warning | Orange/Red Warning | Act Now: Dangerous weather is imminent; follow evacuation orders. |
How is climate change affecting the properties and characteristics of hurricanes?
The relationship between climate change and hurricanes is one of the most active areas of research in Earth sciences. While the total number of storms per year may not be increasing significantly, the characteristics of the storms that do form are changing in ways that make them more dangerous.
As of 2026, the scientific consensus (supported by the IPCC AR6 and recent 2024–2025 studies) points to several key shifts:
1. Increased Intensity (The “Fuel” Effect)
Hurricanes are heat engines that extract energy from the surface of the ocean.
- Warmer Oceans: Global sea surface temperatures have hit record highs in recent years. This provides more “fuel,” leading to an increase in the proportion of high-intensity storms (Category 4 and 5).
- Wind Speed Increase: For every 1°C of ocean warming, a hurricane’s potential wind speed is estimated to increase by about 5%. Recent studies on the 2024 Atlantic season suggest that every single hurricane that year had higher wind speeds than it would have had in a pre-industrial climate.
2. Rapid Intensification (The “Sprint” Mode)
One of the most dangerous trends is how quickly storms now strengthen.
- The Trend: It is now roughly twice as likely for an Atlantic hurricane to jump from a Category 1 to a Major Hurricane (Category 3+) within 24 hours compared to the 1980s.
- Why it matters: Rapid intensification near landfall (seen in storms like Idalia or Otis) gives communities significantly less time to evacuate or complete preparations.
3. Increased Precipitation (The “Sponge” Effect)
A warmer atmosphere can hold more water vapor—approximately 7% more for every 1°C of warming.
- Wetter Storms: This leads to much higher rainfall rates. Attribution studies for storms like Harvey and Helene indicate that human-caused warming increased their total rainfall by 10–15%.
- Inland Flooding: Because the storms are carrying more moisture, the risk of catastrophic freshwater flooding now extends much further inland than in the past.
4. Slower Forward Motion (The “Stalling” Effect)
There is emerging evidence that the atmospheric “steering currents” that move hurricanes across the ocean are weakening.
- Translation Speed: Global studies show that the speed at which storms move across the Earth has slowed by about 10% since 1949.
- The Consequence: When a storm “stalls” (like Dorian over the Bahamas or Harvey over Houston), it subjects a single area to prolonged wind and relentless rain for days rather than hours, exponentially increasing the damage.
5. Enhanced Storm Surge (The “Baseline” Effect)
Even if a hurricane’s physical intensity remained the same, it would still be more destructive today due to Sea Level Rise.
- Higher Starting Point: Global sea levels have risen by about 20 cm (8 inches) since 1900.
- Deeper Inundation: This higher baseline allows the storm surge to push water much further inland and reach higher elevations than it could a century ago. A study of Hurricane Katrina estimated that its flood levels were 15–60% higher specifically because of the sea-level rise that had already occurred since 1900.
Summary of Climate Shifts
| Property | Observed/Projected Change | Primary Driver |
| Frequency | Likely unchanged or slightly lower | Increased wind shear/stability |
| Intensity | Higher (More Cat 4/5 storms) | Warmer sea surface temperatures |
| Rainfall | 10–15% Increase | Warmer, more humid atmosphere |
| Rapid Intensification | Significant Increase | Higher ocean heat content |
| Forward Speed | Slower (More “stalling”) | Weakened steering currents |
| Storm Surge | More Destructive | Rising global sea levels |
What are hurricane-forecasting techniques?
Hurricane forecasting in 2026 has reached a major turning point, moving from a purely physics-based science to a hybrid era where traditional numerical models work alongside rapid artificial intelligence.
The process is divided into three critical stages: data collection, modeling, and human synthesis.
1. Data Collection (The Observation Layer)
You cannot forecast what you cannot see. Modern forecasting relies on a “nested” observation strategy:
- Satellite Constellations: GOES (Geostationary) satellites provide constant 30-second imagery of storm structure, while polar-orbiting satellites use microwave sensors to “see through” clouds to map the underlying rainfall and wind fields.
- Hurricane Hunters: When a storm threatens land, NOAA and the Air Force Reserve fly directly into the eye.
- GPS Dropsondes: These are “reverse weather balloons” dropped from the plane that transmit pressure, temperature, and humidity every 15 feet as they fall to the ocean.
- Tail Doppler Radar (TDR): This allows planes to create a 3D X-ray of the storm’s wind field in real-time.
- The 2026 Upgrade: NOAA is currently phasing in the Gulfstream G550 to replace older high-altitude jets. These new aircraft can fly higher and further, mapping the “steering currents” that dictate a hurricane’s path.
2. The Modeling Layer (The Prediction Engines)
Forecasters now use two fundamentally different types of computer brains:
A. Traditional Numerical Weather Prediction (NWP)
These models, like the HAFS (Hurricane Analysis and Forecast System)—which recently replaced the older HWRF—solve complex fluid dynamics and physics equations.
- Strength: They understand the “why” of the atmosphere (physics-based).
- Weakness: They require massive supercomputers and can take hours to run a single forecast.
B. Artificial Intelligence & Machine Learning (AIWP)
As of 2026, models like Google DeepMind’s GraphCast, NVIDIA’s FourCastNet, and NOAA’s AIGFS have become operational staples.
- Strength: They are 10,000x faster than traditional models. They can run a 10-day forecast on a single high-end GPU in seconds by recognizing patterns in 40 years of historical data.
- Current Performance: In 2025-2026 benchmarks, AI models have consistently outperformed traditional models in track accuracy (where the storm goes), though they still struggle slightly with intensity (how strong it gets).
3. Human Synthesis (The “Expert-in-the-Loop”)
Despite the power of AI, the final forecast issued by the National Hurricane Center (NHC) is still determined by humans.
- Consensus Forecasting: Forecasters look at a “spaghetti plot” of many different models. If the AI models and physics models agree, confidence is high. If they diverge, the forecaster must use their expertise to decide which model is handling the current environment better.
- Risk Communication: AI can predict a path, but it cannot yet explain the nuanced risk to a local emergency manager. Humans translate the data into the colour-coded alerts and “Cone of Uncertainty” used by the public.
Comparison of Forecasting Techniques
| Technique | Primary Tool | Best For… |
| Direct Observation | Dropsondes / Aircraft | Real-time intensity and structure. |
| Physics Modeling (HAFS) | Supercomputers | Predicting “Rapid Intensification.” |
| AI Modeling (GraphCast) | Neural Networks | Fast, long-range track accuracy (up to 10 days). |
| Ensemble Modeling | 30-50 model “runs” | Understanding the “range of possibilities.” |
What’s next for 2026?
The current focus is on Hybrid Modeling, which combines the speed of AI with the physical constraints of NWP to ensure that AI-generated storms don’t “break the laws of physics.”
Is there any investigations and/or attempts at modifying hurricanes?
The idea of controlling or “steering” a hurricane has been a subject of both serious scientific study and science fiction for decades. However, as of 2026, the scientific consensus remains that hurricanes are far too powerful to be modified with our current technology.
Instead, the global focus has shifted entirely toward advanced forecasting and coastal resilience.
1. Historical Attempts: Project STORMFURY (1962–1983)
The most famous attempt to modify hurricanes was a U.S. government program called Project STORMFURY.
- The Hypothesis: Scientists believed that by “seeding” the clouds just outside the hurricane’s eyewall with silver iodide, they could create a new ring of clouds. This would theoretically collapse the original eyewall and replace it with a larger one, spreading the storm’s energy over a wider area and reducing its peak wind speeds.
- The Result: While some experiments (like Hurricane Beulah in 1963 and Hurricane Debbie in 1969) showed a 10–30% decrease in wind speeds, later research proved these changes were likely natural fluctuations.
- The Conclusion: Scientists discovered that hurricanes naturally go through “eyewall replacement cycles” on their own. Additionally, they found that hurricanes don’t contain enough supercooled water for cloud seeding to be effective. The project was shuttered in 1983.
2. Modern Theoretical Concepts
While no active government programs are currently attempting to “break” hurricanes, several theoretical methods have been proposed in recent years:
- Ocean Cooling: Since hurricanes are fueled by warm water, some have proposed using massive pumps to bring cold water from the deep ocean to the surface in the path of a storm.
- The Problem: The scale required is astronomical. You would need thousands of pumps over thousands of square miles to make a dent in a major hurricane’s energy.
- Hygroscopic Polymers (The “Gel” Method): There have been theories about dropping specialized water-absorbing powders into a storm to “weigh down” the moisture and cause it to dissipate.
- The Problem: A single hurricane can drop billions of tons of rain; the amount of polymer required would be logistically impossible to transport and drop.
- Solar Geoengineering: More recently, some researchers have looked at Stratospheric Aerosol Injection (reflecting sunlight to cool the planet overall). While this might reduce the frequency of the most intense storms over decades, it is not a “tactical” tool to stop a single hurricane in its tracks.
3. Why Modification is a “Non-Starter” in 2026
There are three primary reasons why we don’t attempt to modify hurricanes today:
- Energy Disparity: A single hurricane releases energy equivalent to half of the world’s total electrical generating capacity every second. Humans simply do not have a “lever” big enough to move that much energy.
- Unintended Consequences: If you successfully diverted a hurricane away from Miami, you might accidentally steer it into the Bahamas or change the rainfall patterns in Europe. The legal and geopolitical liability of “moving” a disaster is an international nightmare.
- The “Better Forecasting” ROI: In 2025 and 2026, governments have found that $1 spent on AI-driven forecasting and better building codes saves more lives than $1,000 spent on highly speculative modification tech.
Comparison of Modification vs. Adaptation
| Method | Status in 2026 | Practicality |
| Cloud Seeding | Abandoned | Ineffective in high-wind systems. |
| Ocean Cooling | Theoretical | Logistically impossible at scale. |
| AI Forecasting | Active & Essential | Reduces fatalities through better warnings. |
| Resilient Infra | Active & Essential | Protects property from inevitable storms. |
A Note on Recent 2025/2026 Trends: Following the devastating 2024 and 2025 seasons (including the hypothetical but impactful “Hurricane Melissa” in some research models), there has been a surge in misinformation claiming that hurricanes are being “steered” by government lasers or antennas (like HAARP). Professional meteorologists and organizations like NOAA have been very clear that these claims are scientifically impossible.
Does artificial intelligence play a role in hurricane forecasting?
The short answer is yes, and 2026 is being called a “watershed year” for this technology. While the National Hurricane Center (NHC) has used basic AI tools for years, the 2025 and 2026 seasons have seen a massive shift. We have moved from experimental “pattern matching” to operational AI weather prediction (AIWP) that now rivals—and sometimes beats—the multi-million dollar supercomputer models we’ve relied on for decades.
1. The Speed Revolution
The most immediate impact of AI is efficiency. Traditional physics-based models (like the HAFS or ECMWF) work by solving millions of calculus equations to simulate the atmosphere.
- Traditional Models: Take several hours and a room-sized supercomputer to run a single forecast.
- AI Models: Use “machine learning” to recognize patterns from 40 years of historical data. They can generate a 10-day forecast in under one minute on a single desktop computer.
This speed allows meteorologists to run “Ensemble Forecasts”—running the same model thousands of times with tiny variations—to see the full range of possible paths a storm might take.
2. Major AI Players in 2026
Three specific AI systems are currently being integrated into the NHC’s “toolbox”:
- Google DeepMind’s GraphCast: In 2024 and 2025, this model correctly predicted the landfalls of Hurricane Beryl (Texas) and Hurricane Francine (Louisiana) days before traditional models.
- NOAA’s AIGFS: Deployed officially in January 2026, this is the AI version of the American “Global Forecast System.” It uses 99.7% less computing power than the original.
- University of Miami Wave Tracker: A specialized AI tool used by NHC to spot “tropical waves”—the small, disorganized clusters of clouds that have the potential to grow into hurricanes.
3. Track vs. Intensity: The Current Gap
While AI is currently winning the battle of Track (where the storm goes), it still faces challenges with Intensity (how strong it gets).
- Tracks: AI models are now consistently more accurate than physics models at predicting a storm’s path 3 to 7 days in advance.
- Intensity: Because hurricanes are driven by complex “micro-physics” (like heat exchange at the ocean surface), traditional physics models are still better at predicting Rapid Intensification.
- The 2026 Solution: Scientists are now deploying “Hybrid Models” that use AI for the path but check the results against physics equations to ensure the storm’s strength is realistic.
4. The “Expert-in-the-Loop”
A common question in 2026 is whether AI will replace human meteorologists. The consensus from ECCC and the NHC is a firm no.
- Synthesis: Humans are still required to “referee” the models when they disagree. For example, during Hurricane Melissa in 2025, AI models identified the track earlier, but human forecasters had to decide when to trigger the Red Warning alerts based on the likely impact on local infrastructure.
- Communication: AI can predict a 4-meter storm surge, but it cannot explain to a mayor why a specific neighborhood needs to evacuate immediately.
Summary Table: AI in 2026 Forecasting
| Feature | Traditional Physics Models | AI Weather Prediction (AIWP) |
| Compute Power | Massive Supercomputers | Single GPU / High-end Laptop |
| Forecast Time | 1 to 6 Hours | ~60 Seconds |
| Accuracy (Track) | High | Superior (3–10 Day Range) |
| Accuracy (Intensity) | Superior | Improving (Still struggles) |
| Main Advantage | Understands the “Why” | Fast “Pattern Recognition” |
Solved Problems
These application problems are designed to bridge the gap between traditional atmospheric physics and the emerging field of AI-driven meteorology. They focus on the critical decision-making points faced by professional forecasters in 2026.
Part 1: Physical Dynamics & Tropical Transitions
1. The Warm-Core Paradox
- Problem: A low-pressure system is moving over 28°C water, but satellite imagery shows a broad, asymmetric cloud shield with distinct frontal boundaries. Is this a hurricane?
- Reasoning: Hurricanes are “warm-core” and symmetric; they do not possess fronts.
- Solution: No. This is likely an extratropical or subtropical cyclone. A true hurricane requires a centralized heat engine fueled by latent heat, not horizontal temperature gradients.
2. The “Left Hook” Steering Case
- Problem: A hurricane is moving North at 40°N latitude. A massive “Blocking High” is situated over Greenland. Predict the track deviation.
- Reasoning: High pressure acts as a physical barrier. If the steering currents are blocked to the East and North, the storm must “escape” to the West.
- Solution: The storm will likely take a rare “left hook” turn toward the coastline (similar to Sandy 2012).
3. The Orographic Rain-Bomb
- Problem: A weakening Tropical Depression with 100mm of precipitable water hits a 2,000m mountain range. Calculate the primary flood risk.
- Reasoning: Orographic lift forces moist air upward rapidly, cooling it and wringing out moisture much faster than over flat land.
- Solution: Expect localized “Rain-Bomb” flash flooding and mudslides on the windward slopes, even if wind speeds are low.
4. Rapid Intensification (RI) Identification
- Problem: A storm’s central pressure drops by 42 mbar in 24 hours. What is the meteorological classification of this event?
- Reasoning: The standard definition for RI is a drop of at least 35 mbar in 24 hours.
- Solution: This is “Explosive Deepening” or Rapid Intensification, likely caused by crossing a warm-water eddy (High Ocean Heat Content).
5. The Eyewall Replacement Cycle (ERC)
- Problem: A Category 5 hurricane’s inner eye begins to shrink and cloud over, while a second outer ring of thunderstorms forms. What happens to the wind speed in the next 6 hours?
- Reasoning: During an ERC, the inner eye collapses and the outer eye takes over.
- Solution: The peak wind speed will temporarily decrease, but the overall wind field will expand in size.
Part 2: Storm Surge & Coastal Impact
6. Bathymetry vs. Surge
- Problem: Two identical Category 3 hurricanes hit different coasts. Coast A has a deep, steep drop-off. Coast B has a wide, shallow continental shelf. Which sees a higher surge?
- Reasoning: Shallow water allows the wind to “pile up” water more effectively against the land.
- Solution: Coast B. Shallow bathymetry dramatically amplifies storm surge height.
7. The “Right-Front” Danger Zone
- Problem: A hurricane moving North at 20 km/h has internal sustained winds of 150 km/h. What is the approximate wind speed felt on the East (Right) side of the eye?
- Reasoning: The storm’s forward motion adds to the wind speed on the right side in the Northern Hemisphere.
- Solution: $150 + 20 = 170$ km/h. (The left side would feel approximately 130 km/h).
8. Freshwater vs. Saltwater Inundation
- Problem: A storm makes landfall during a “King Tide” (Highest astronomical tide). Does this affect the Rainfall Flood forecast?
- Reasoning: While rain is freshwater, the high tide prevents inland rivers from draining into the sea.
- Solution: Yes. The high sea level creates a “backup” effect, worsening inland freshwater flooding.
Part 3: AI-Integrated Forecasting Problems
9. AI Track vs. Physics Intensity
- Problem: The AI model (GraphCast) predicts a landfall in 5 days, but the physics model (HAFS) predicts the storm will dissipate. Which do you trust for the “Watch” area?
- Reasoning: AI is currently superior at pattern-matching long-range tracks, while physics models are better at understanding structural decay.
- Solution: Use the AI track to define the broad “Watch” area, but wait for physics-based consensus before issuing a high-intensity “Warning.”
10. Training Data Bias (The “Black Swan”)
- Problem: An AI model is forecasting a storm in the South Atlantic (where they are extremely rare). Why might the AI struggle here?
- Reasoning: AIWP models rely on 40+ years of historical data. If an event has rarely happened in that data, the model lacks a “template.”
- Solution: The AI may under-predict the intensity. Rely on physics-based NWP models for rare, “out-of-sample” geographical locations.
11. The Hybrid “Confidence” Score
- Problem: You have 50 AI ensemble runs. 45 show a direct hit, but 5 show the storm turning out to sea. How do you communicate the risk?
- Reasoning: This is a “High Confidence” scenario (90% agreement).
- Solution: Issue an Orange or Red Alert (depending on impact) with high confidence, noting the 10% outlier possibility.
12. AI for Rapid “Genesis” Detection
- Problem: A disorganized cluster of clouds in the Atlantic has no “closed circulation.” Can AI help?
- Reasoning: AI is excellent at “Computer Vision”—detecting the very first signs of rotation in satellite loops before human eyes or math models pick it up.
- Solution: Use AI-generated “Genesis Probability” to alert Hurricane Hunters to fly out and investigate 12–24 hours earlier than usual.
Part 4: Communication & Policy (The 2026 ECCC System)
13. Colour-Code Transition
- Problem: A Category 1 hurricane is hitting a region with a 90% “dead-tree” rate due to a previous drought. What ECCC colour alert is appropriate?
- Reasoning: A Cat 1 is normally “Yellow/Orange,” but the dead trees mean a high risk of total grid failure.
- Solution: Upgrade to an Orange or Red Warning based on the impact of falling trees on the power grid.
14. The “Post-Tropical” Alert Gap
- Problem: A storm is losing its tropical characteristics (becoming extratropical) but still has 120 km/h winds. Do you cancel the Hurricane Warning?
- Reasoning: The “Sandy Rule” states that the hazard is more important than the technical name.
- Solution: Maintain the Warning. In 2026, ECCC/NHC alert for the impact (wind/surge) regardless of the storm’s thermal core.
15. AI-Driven Evacuation Timing
- Problem: An AI model predicts a 20% chance of a “Red” impact event but an 80% chance of “Yellow.” When do you trigger a mandatory evacuation?
- Reasoning: Evacuations are costly. Forecasters use “Cost-Loss” ratios.
- Solution: If the “Red” impact involves life-threatening storm surge, trigger the evacuation even at 20% probability, as the “Cost” of a false alarm is lower than the “Loss” of life.