
Meteorology Today Second Canadian Edition
Earth and Atmospheric Sciences
Understanding Middle-Latitude Cyclones
Middle-latitude cyclones (also known as extratropical cyclones) are large-scale, low-pressure systems that drive much of the weather in the Earth’s mid-latitudes—the regions between roughly 30° and 60° latitude in both hemispheres. Unlike tropical cyclones (hurricanes), which thrive on warm ocean waters, these systems are powered by sharp temperature contrasts between cold and warm air masses.
Key Characteristics

These systems are massive, often spanning 1,000 kilometers or more, and are defined by several distinct features:
- Low Pressure: The center of the storm is a zone of rising air and low atmospheric pressure.
- Cyclonic Flow: Due to the Coriolis effect, the air rotates counterclockwise in the Northern Hemisphere and clockwise in the Southern Hemisphere.
- Frontal Boundaries: These cyclones are almost always associated with cold fronts and warm fronts, which separate different air masses.
Life Cycle: The Polar Front Theory
Meteorologists use the “Norwegian Cyclone Model” to describe how these storms develop and eventually dissipate:
- Cyclogenesis: The process begins along the polar front, where cold polar air meets warmer subtropical air. A “kink” or wave forms along the front, often triggered by disturbances in the upper-atmosphere jet stream.
- Mature Stage: As the pressure drops, the system becomes well-defined. A warm front moves ahead of the center, and a faster-moving cold front trails behind it. This creates a “warm sector” of air between the two fronts.
- Occlusion: Because cold fronts travel faster than warm fronts, the cold front eventually catches up to the warm front. This lifts the warm air entirely off the ground, forming an occluded front.
- Dissipation: Once the temperature contrast is gone and the warm air is fully displaced upward, the system loses its energy source and begins to weaken.
The Role of the Jet Stream
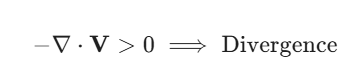
Middle-latitude cyclones are heavily influenced by the jet stream (high-altitude, fast-moving winds). For a surface low-pressure system to intensify, there must be upper-level divergence—essentially, air being “pumped out” at the top faster than it flows in at the bottom. This maintains the low pressure at the surface and keeps the storm growing.
What is the polar-front theory?
The Polar Front Theory, also known as the Norwegian Cyclone Model, was developed by meteorologists at the Bergen School of Meteorology during World War I. It provides a framework for understanding how middle-latitude cyclones (extratropical cyclones) are born, grow, and eventually dissipate.
The theory centers on the polar front, a semi-permanent boundary between cold polar air and warm subtropical air.
The Life Cycle of a Cyclone
According to this model, a mid-latitude cyclone progresses through several distinct stages:
1. The Stationary Phase
Initially, the polar front is a stationary boundary where cold and warm air flow parallel to each other in opposite directions. There is no vertical movement, and the pressure along the front is relatively uniform.
2. The Wave Stage (Cyclogenesis)
A disturbance, often caused by a ripple in the upper-level jet stream, creates a “kink” or wave in the front.

- Warm air begins to push northward, creating a warm front.
- Cold air begins to push southward, creating a cold front.
- A center of low pressure forms at the apex of the wave.
3. The Mature Stage
As the pressure at the center continues to drop, the cyclonic circulation strengthens. The warm sector—the wedge of warm air between the two fronts—is well-defined. Precipitation is typically widespread ahead of the warm front and more intense/concentrated along the cold front.
4. The Occluded Stage
Because cold fronts are denser and more efficient at moving air, they travel faster than warm fronts. Eventually, the cold front “catches” the warm front. This forces the warm sector air upward, away from the surface. This junction is called an occluded front.
5. Dissipation
Once the warm air is completely lifted and the surface is dominated by cold air, the temperature contrast (the storm’s “fuel”) is gone. The pressure gradient weakens, and the cyclone slowly dissipates.
Why It Matters
The Polar Front Theory was revolutionary because it shifted meteorology from simply observing surface weather to understanding the three-dimensional structure of the atmosphere. It highlighted that weather is not just a localized event but a result of massive air masses interacting at boundaries.
Mathematical Context
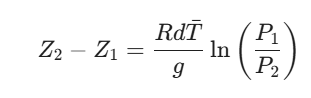
In atmospheric dynamics, the growth of these waves can be modeled using the baroclinic instability equations. A simplified representation of the pressure change over time can be expressed through the Hypsometric Equation, which relates the thickness of an atmospheric layer (Z2 – Z1) to its average temperature (T):
This explains why the cold, dense air behind the front and the warm, less-dense air in front of it drive the vertical motions and pressure changes essential to the cyclone’s life.
Where do middle-latitude cyclones form?
Middle-latitude cyclones tend to form in specific geographic regions where the atmosphere is naturally unstable. The primary requirement for their birth is a sharp temperature gradient, which occurs where cold, polar air meets warm, subtropical air.
In North America, there are several “breeding grounds” for these systems, often influenced by mountain ranges and coastal boundaries.
Primary Formation Regions
- The Leeward Side of Mountains: As air moves over a mountain range (like the Rockies), it is compressed and then expands as it descends the other side. This “stretching” of the air column can create a localized area of low pressure.
- Alberta Clippers: These form on the lee side of the Canadian Rockies and move quickly across the northern tier of the United States and southern Canada.
- Colorado Lows: These develop near the central Rockies and often bring significant snow or severe weather to the Great Plains and Midwest.
- Coastal Boundaries: Significant temperature differences between cold land and relatively warm ocean currents provide the energy needed for cyclogenesis.
- Gulf Lows: These form along the Gulf Coast of the U.S., where the warm moisture from the Gulf of Mexico interacts with colder continental air.
- Hatteras Lows (Nor’easters): These form off the coast of North Carolina (Cape Hatteras). The contrast between the cold land and the warm Gulf Stream current can cause these storms to intensify rapidly as they move up the Eastern Seaboard.
Global “Storm Tracks”
While they can form in various spots, these cyclones generally follow established storm tracks dictated by the prevailing westerly winds and the position of the jet stream.

- The North Pacific Track: Many cyclones form near the coast of Asia or the Aleutian Islands and travel toward the Gulf of Alaska or the Pacific Northwest.
- The North Atlantic Track: Systems often develop off the East Coast of North America and travel toward Western Europe and Iceland (often referred to as the Icelandic Low).
Vertical Requirements
Regardless of the surface location, a middle-latitude cyclone cannot form without help from high above. They require upper-level divergence—usually found in the left-exit or right-entrance regions of a jet streak (a pocket of faster winds within the jet stream).
If the air at the top of the atmosphere is being pulled apart (divergence), it creates a vacuum effect that sucks air up from the surface, lowering the surface pressure and “spinning up” the cyclone.
Where V is the horizontal wind vector. When this value is positive at high altitudes, it supports the growth of the low-pressure system below.
What is the character of East Coast storms?
Storms along the East Coast of North America—often called Nor’easters—have a distinct character because of the unique geography of the Atlantic seaboard. Unlike the fast-moving storms that cross the plains, these systems are known for their intensity, high moisture content, and longevity.
Key Characteristics
- The Energy Source: These storms thrive on the extreme temperature contrast (baroclinic instability) between the cold continental air over land and the warm waters of the Gulf Stream just offshore.
- Wind Direction: They get their name because the winds over coastal areas blow from the northeast as the low-pressure center passes just to the south or east.
- High Moisture: Because they develop over the Atlantic, they have access to a massive reservoir of water vapor. This leads to heavy, wet snow or torrential rains, depending on the exact track.
- Slow Movement: While an “Alberta Clipper” might zip across the continent in a day, East Coast storms often stall or move slowly, leading to prolonged periods of impact (sometimes 24 to 48 hours).
Impact Zones and Hazards
| Hazard | Description |
| Heavy Precipitation | Can produce several feet of snow in the “comma head” of the storm or several inches of rain in warmer sectors. |
| Coastal Flooding | Strong onshore winds combined with low atmospheric pressure cause “storm surges” that can erode beaches and flood low-lying areas. |
| High Winds | These storms can reach intensities comparable to Category 1 or 2 hurricanes, leading to power outages and structural damage. |
The “Bomb Cyclone” Phenomenon

Many East Coast storms undergo bombogenesis. This occurs when the central pressure of the cyclone drops by at least 24 millibars in 24 hours.
Mathematically, this rapid intensification is driven by massive upper-level divergence. Using the Vorticity Equation, we can see how the rotation (ζ) increases as the air columns are stretched vertically:
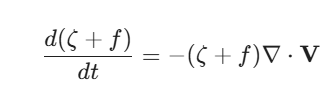
Where (ζ + f) is the absolute vorticity and $\nabla \cdot \mathbf{V}$ is the horizontal divergence. On the East Coast, the jet stream often provides the perfect “vacuum” upstairs to trigger this explosive growth.
Comparison: Nor’easters vs. Clippers
While both are middle-latitude cyclones, they behave very differently:
- Nor’easters: Massive, moisture-rich, slow-moving, and potentially destructive. They are “warm-core” at low levels due to the ocean but “cold-core” aloft.
- Clippers: Small, moisture-starved (dry snow), very fast-moving, and generally bring much colder air in their wake but less total accumulation.
What is the vertical structure of lows?
The vertical structure of a low-pressure system is the “engine” that keeps it alive. For a middle-latitude cyclone to intensify, its center must tilt with height. If a low were perfectly vertical, it would quickly fill with air and dissipate.
1. The Vertical Tilt
In a developing cyclone, the center of the low-pressure system at the surface is not directly beneath the center of the low pressure aloft (the upper-level trough).
- Westward Tilt: The surface low is typically located to the east of the upper-level trough.
- The Mechanism: This tilt allows for upper-level divergence to occur directly above the surface low. As the jet stream moves air away from the top of the column, the surface pressure stays low, forcing more air to rise from the ground.
2. Convergence vs. Divergence
The survival of a low is a balancing act between air flowing in at the bottom and air being removed at the top:
- Surface Convergence: Friction near the ground causes air to spiral inward toward the center of the low. This adds mass to the column.
- Upper-Level Divergence: High in the troposphere (near the jet stream), air is spread apart.
- The Rule of Intensification:
- If Divergence > Convergence, the surface pressure falls, and the storm strengthens.
- If Convergence > Divergence, the surface pressure rises, and the storm “fills” and weakens.
3. Temperature and Pressure (The Hypsometric Relationship)
Because cold air is denser than warm air, pressure decreases more rapidly with height in a cold air mass than in a warm one. This is why upper-level troughs (lows) are usually associated with cold air below them.
In a mature cyclone:
- The Cold Core: The area behind the cold front has very low “thickness” (the vertical distance between two pressure levels).
- The Warm Sector: The area between the warm and cold fronts has high thickness.
The Hypsometric Equation mathematically describes this relationship between temperature (T-bar) and the thickness of the atmosphere (ΔZ):
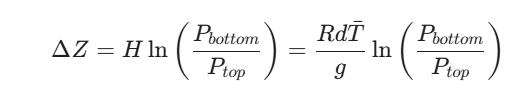
This shows that as the average temperature of the air column increases, the thickness between pressure surfaces also increases, which is why the “height” of a pressure surface (like the 500mb map) ripples into ridges and troughs.
4. Stacked Lows (The Death Stage)
Eventually, the system becomes “vertically stacked.” This happens when the surface low moves directly underneath the upper-level low.
When this occurs, the divergence aloft is no longer offset to the side; the “pump” stops working effectively. Surface convergence begins to win, the central pressure rises, and the cyclone dissipates.
What is the interaction between convergence and divergence?
In atmospheric science, the interaction between convergence and divergence is essentially a giant “air-recycling” system that determines whether a surface weather feature will strengthen or die. To keep a low-pressure system (cyclone) or a high-pressure system (anticyclone) alive, the atmosphere must maintain a vertical balance of mass.
The “Sucking and Filling” Principle
Think of a surface low-pressure system like a vacuum cleaner. For it to keep “sucking” air from the ground, it must exhaust that air out of the top.
1. Strengthening a Low (Cyclogenesis)
- Surface Convergence: Because of friction and the pressure gradient, air spirals inward toward the center of a low. This adds mass to the air column.
- Upper-Level Divergence: At the level of the jet stream, air is spread apart and “exhausted” away from the column.
- The Interaction: If Upper-Level Divergence > Surface Convergence, the net mass of the column decreases. The pressure at the bottom falls, and the storm intensifies.
2. Strengthening a High (Anticyclogenesis)
- Upper-Level Convergence: Air at high altitudes is pushed together. This forces the air to sink because it has nowhere else to go.
- Surface Divergence: As the sinking air hits the ground, it spreads outward away from the center of the high.
- The Interaction: If Upper-Level Convergence > Surface Divergence, the net mass of the column increases. The surface pressure rises, and the high-pressure system strengthens.
The Role of Vertical Motion
The interaction between these two forces dictates vertical wind:
- Rising Air: Occurs between surface convergence and upper-level divergence. This leads to cooling, condensation, clouds, and precipitation.
- Sinking Air (Subsidence): Occurs between upper-level convergence and surface divergence. This leads to warming and drying, which is why high-pressure systems are usually associated with clear skies.
The Mathematical Link: The Continuity Equation
The relationship is formally described by the Continuity Equation, which states that mass cannot be created or destroyed. In a simplified form for a column of air:
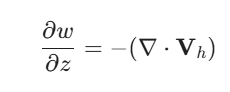
Where:
- w is vertical velocity.
- z is height.
- -(∇•Vh) is horizontal divergence.
This tells us that a change in vertical motion with height ( w}{\partial z}$) must be balanced by horizontal divergence or convergence. If you have convergence at the bottom (negative divergence), you must have an increase in vertical motion (rising air).

Why the Jet Stream Matters
The jet stream provides the necessary “exhaust” for surface lows. In the Diffluence regions (where jet stream winds spread out) and the Left-Exit region of a jet streak, divergence is naturally higher. When a surface low-pressure system moves under one of these “sweet spots” aloft, it is primed for rapid development.
What is the relationship between upper-level waves and middle-latitude cyclones?
The relationship between upper-level waves and middle-latitude cyclones is one of mutual dependence. While we often experience weather at the surface, the “steering” and “fueling” of that weather occur several kilometers above our heads in the form of Rossby waves—long waves in the upper-atmosphere westerlies.
1. The Steering Mechanism
The upper-level flow acts as a conveyor belt. The winds at the 500 mb level (roughly 5,600 meters) determine the path that a surface cyclone will take. Generally, a surface low will travel in the same direction as the upper-level winds, but at about half the speed.
2. The Development Mechanism (The “Tilt”)
As we’ve discussed, for a cyclone to intensify, it needs to be located in a specific spot relative to these upper-level waves:
- The Trough: An upper-level wave consists of a trough (a valley of low pressure) and a ridge (a peak of high pressure).
- Downstream of the Trough: Surface cyclones almost always form east of an upper-level trough.
- The Interaction: In this position, the upper-level winds are spreading apart (divergence). This removes air from the column, allowing the surface low to deepen. If the surface low were directly under the trough, it would be “vertically stacked” and would stop growing.

3. Energy Exchange (Baroclinic Instability)
Upper-level waves help convert potential energy into kinetic energy. When these waves have a high amplitude (deep troughs and high ridges), it allows cold air to surge southward and warm air to surge northward.
This creates Baroclinic Instability, where the “tilting” of the pressure systems allows the storm to draw energy from the temperature contrast. Mathematically, the growth rate of these waves can be approximated by the Eady model growth rate (σ):
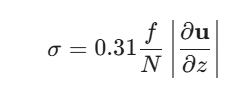
Where:
- f is the Coriolis parameter.
- N is the Brunt-Väisälä frequency (stability).
- ∂u/∂z is the vertical wind shear.
This shows that the stronger the upper-level winds are compared to the surface winds (vertical shear), the faster the surface cyclone can develop.
4. Self-Amplification
The relationship is a two-way street. While the upper-level wave creates the surface cyclone, the cyclone also “feeds” the wave:
- The cyclone’s warm front pushes warm air northward, which builds an upper-level ridge ahead of it.
- The cold front pushes cold air southward, which deepens the upper-level trough behind it.
- This increases the wave’s amplitude, which in turn makes the surface storm even stronger.
Summary of the Connection
| Feature | Role in the Relationship |
| Rossby Waves | Provide the large-scale “environment” for storm development. |
| Trough Axis | Positioned to the west of the surface low to provide “suction” (divergence). |
| Shortwaves | Smaller ripples within the long waves that often “kick-start” rapid cyclogenesis. |
| Jet Streak | Pockets of intense wind within the wave that maximize divergence. |
What does a middle-latitude cyclone need to develop?
To develop and intensify, a middle-latitude cyclone requires a specific set of atmospheric conditions working in harmony across different layers of the atmosphere. Meteorologists often refer to this as cyclogenesis.
The four essential “ingredients” are:
1. A Temperature Gradient (Baroclinic Instability)
Middle-latitude cyclones are fueled by the temperature contrast between different air masses. There must be a boundary (a front) where cold, dry polar air meets warm, moist subtropical air.
- Energy Source: The storm converts the potential energy stored in these temperature differences into kinetic energy (wind and motion).
- Without this “thermal fuel,” the cyclone cannot grow.
2. Upper-Level Divergence
This is perhaps the most critical mechanical requirement. For a low-pressure system at the surface to deepen (lower its pressure), air must be removed from the top of the atmospheric column faster than it flows in at the bottom.
- The “Vacuum” Effect: This “exhaust” usually occurs in the left-exit or right-entrance regions of a jet streak (a pocket of maximum wind speed within the jet stream).
- If the air aloft is spreading out (diverging), it forces air from the surface to rise, lowering the surface pressure.
3. Vertical Tilt (The Westward Tilt)
A developing cyclone must tilt with height. If the surface low-pressure center is located directly beneath the upper-level low (trough), the system is “vertically stacked” and will dissipate.
- Proper Alignment: The surface low must be positioned downstream (east) of the upper-level trough.
- This offset ensures that the strongest upper-level divergence is positioned directly over the surface low, allowing the “pump” to keep working.
4. Vorticity (Spin)
There must be an initial “kick” or ripple to start the rotation. This is often provided by a shortwave trough—a smaller ripple moving through the larger Rossby wave pattern in the upper atmosphere.
- Vorticity Advection: As the upper-level wind carries “spin” into a region, it enhances the vertical motion.
- The Coriolis Effect then sustains this rotation as the air moves toward the center of the low.
The Mathematical Threshold
The growth of these systems is often modeled using the Rossby number ($Ro$ ), which helps determine if the flow is dominated by the Earth’s rotation or by inertial forces. For these large-scale cyclones, the Rossby number is typically small:
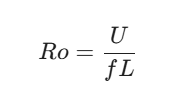
Where:
- U is the characteristic velocity.
- f is the Coriolis parameter.
- L is the characteristic length scale.
When Ro is low, the Coriolis force is significant enough to organize the inward-flowing air into the classic cyclonic spiral.
Summary: The “Perfect Storm” Checklist
- Stationary Front: An initial boundary to provide the “kink.”
- Jet Stream Support: To provide the upper-level “exhaust.”
- Moisture: Especially for coastal storms, as the release of latent heat during condensation provides extra energy to the rising air.
What is upper air support?
upper air support refers to the specific conditions in the middle and upper levels of the troposphere (usually at the 500 mb level or higher) that act as the “engine” for surface weather systems.
Without upper air support, a surface low-pressure system would quickly “fill” with air and dissipate due to friction. To grow, a storm needs help from the winds blowing 5 to 10 kilometers above the ground.
The Two Pillars of Upper Air Support
For a cyclone to intensify, the upper atmosphere must provide two things simultaneously: Mass Removal and Directional Guidance.
1. Upper-Level Divergence (The Exhaust)
This is the most critical component. Surface lows naturally have convergence—air spiraling inward at the ground. If that air has nowhere to go, the pressure at the center rises, and the storm dies.
- The “Pump”: Upper air support provides divergence, where winds spread apart aloft.
- The Result: If the divergence aloft is stronger than the convergence at the surface, there is a net loss of air in that vertical column. This lowers the surface pressure and “sucks” more air upward, intensifying the storm.
2. Vorticity Advection (The Trigger)
Vorticity is simply a measure of the “spin” in the atmosphere.
- Positive Vorticity Advection (PVA): When the jet stream carries a region of high spin (usually from an upper-level trough) toward a region of lower spin, it creates a “lifting” effect in the atmosphere.
- The Trigger: Meteorologists look for PVA on 500 mb maps to identify where a surface low is most likely to develop or strengthen.
The Role of the Jet Stream
The jet stream is the primary provider of upper air support. Specifically, certain regions within the jet stream are better at providing support than others:
- The Left-Exit Region: As air exits a “jet streak” (a pocket of maximum wind) and turns left, it naturally spreads out (diverges).
- The Right-Entrance Region: As air enters a jet streak, it also tends to diverge on the right side.
- The Result: If a surface low moves under either of these two regions, it receives massive “support” and can undergo rapid intensification, sometimes becoming a “bomb cyclone.”
Why “Vertical Tilt” is Required
For upper air support to be effective, the system must tilt with height.
- If the upper-level low is directly over the surface low, the “exhaust” is poorly positioned.
- Ideal Support: The upper-level trough should be located to the west of the surface low. This ensures the strongest divergence (located on the east side of the trough) is positioned directly over the surface storm.
Mathematical Perspective: The Omega Equation
Meteorologists use the Omega Equation to calculate the vertical motion ($\omega$) caused by upper air support. A simplified version shows that rising motion is driven by:
- Differential Vorticity Advection: How spin changes with height.
- Thermal Advection: How temperature is being moved by the wind.
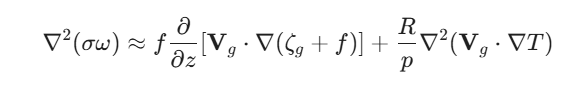
When these terms are positive, the “upper air support” is strong, forcing air to rise and creating the clouds and precipitation we see at the surface.
What role does the jet stream play?
The jet stream is the “engine room” of the atmosphere for the mid-latitudes. While we feel the wind and rain at the surface, the jet stream—a high-altitude ribbon of fast-moving air—is responsible for creating, intensifying, and steering those weather systems.
Its role can be broken down into three primary functions: Exhaust, Trigger, and Guide.
1. The Exhaust System (Divergence)
As discussed earlier, a surface low-pressure system is essentially a pile of air. Because air spirals inward at the surface (convergence), the “pile” would naturally grow and the low pressure would disappear if that air wasn’t removed.
- The Vacuum Effect: The jet stream provides the necessary “suction.” In specific regions of the jet, air naturally spreads apart (divergence).
- Mass Removal: When the jet stream removes air from the top of the column faster than it converges at the bottom, the surface pressure drops, and the cyclone intensifies.
2. The Trigger (Jet Streaks)
The jet stream isn’t a uniform river; it has pockets of exceptionally fast wind called jet streaks. As air enters and leaves these streaks, it creates four distinct “quadrants” of vertical motion:
- Left-Exit & Right-Entrance: These are the “sweet spots” where upper-level divergence is strongest. If a surface boundary (front) sits under these quadrants, the jet streak will “kick-start” the formation of a cyclone.
- Right-Exit & Left-Entrance: These regions feature upper-level convergence, which forces air to sink and builds high-pressure systems (anticyclones).
3. The Steering Guide (Storm Tracks)
The jet stream acts as a conveyor belt for storms. Middle-latitude cyclones are “embedded” in the larger flow of the upper atmosphere.
- Path of Least Resistance: Cyclones generally follow the path of the jet stream. If the jet dips far south (a trough), the storms follow that dip.
- Speed: The speed of the jet stream determines how fast weather systems move across the continent. A “zonal” (straight west-to-east) jet leads to fast-moving, alternating weather, while a “meridional” (wavy) jet can lead to “blocking” patterns where weather stays stuck over one region for days.
Seasonal Influence
The jet stream is driven by the temperature contrast between the poles and the equator.
- Winter: The contrast is greatest, making the jet stream stronger and pushing it further south. This is why winter storms are typically more frequent and intense.
- Summer: The contrast weakens, the jet stream moves north (often into Canada), and surface storms become weaker and less frequent in the mid-latitudes.
Summary of Jet Stream Roles
| Function | Result at the Surface |
| Divergence Aloft | Deepens surface lows (intensifies storms). |
| Convergence Aloft | Builds surface highs (fair weather). |
| Jet Streaks | Triggers rapid storm development (cyclogenesis). |
| Rossby Waves | Determines the “storm track” or path of the systems. |
This educational video on the jet stream explains the science behind high-altitude wind patterns and how they dictate extreme weather events like snowstorms and heatwaves.
What is the relationship between jet streaks and storms?
The relationship between jet streaks and storms is essentially a high-altitude “vacuum system.” While the jet stream is a broad river of wind, jet streaks are smaller pockets of exceptionally fast air within that river. These streaks provide the localized “lift” and “suction” required to trigger and intensify surface storms.
The Four-Quadrant Model
When air enters and exits a jet streak, it undergoes rapid acceleration and deceleration. This causes air to “pile up” in some areas and “spread out” in others. Meteorologists divide the jet streak into four quadrants to predict surface weather:
| Quadrant | Upper-Level Action | Surface Result |
| Left-Entrance | Convergence (Air piles up) | Sinking air / High Pressure (Fair weather) |
| Right-Entrance | Divergence (Air spreads out) | Rising air / Low Pressure (Storms) |
| Left-Exit | Divergence (Air spreads out) | Rising air / Low Pressure (Storms) |
| Right-Exit | Convergence (Air piles up) | Sinking air / High Pressure (Fair weather) |
How Jet Streaks Build Storms
The “sweet spots” for storm development are the Left-Exit and Right-Entrance regions. Here is how they interact with the surface:
- The Exhaust Effect: In these two quadrants, air at the top of the troposphere is being pulled apart (divergence). This creates a vacuum-like effect.
- The Surface Response: To fill that vacuum, air from the surface is sucked upward. As this air rises, it cools and condenses, forming the clouds and precipitation we associate with storms.
- Cyclogenesis: If this rising air is positioned over a stationary front or a region with high temperature contrasts, it will cause the surface pressure to drop rapidly, “spinning up” a middle-latitude cyclone.
“Bombing Out” and Rapid Intensification
When a surface low-pressure system moves directly under the left-exit region of a powerful jet streak, the “exhaust” can become so efficient that the storm intensifies at an extreme rate.
This is often the primary driver behind bomb cyclones. If the divergence aloft is vastly superior to the convergence at the surface, the central pressure can drop more than 24 millibars in 24 hours, leading to hurricane-force winds and massive snowfall.
Cross-Stream Circulation
Inside the jet streak, the atmosphere tries to maintain balance through the Ageostrophic Wind. This creates a “vertical circulation” where:
- Air rises in the divergent quadrants.
- Air sinks in the convergent quadrants.
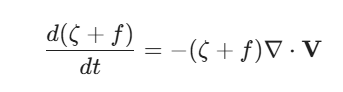
Mathematically, this is related to the Vorticity Equation. As air moves into the exit region, its absolute vorticity (ζ + f) decreases rapidly, which—according to the continuity equation—forces the air to spread out (diverge) horizontally:
Where ∇ • Vh represents the horizontal divergence.
What is the conveyor belt model?
Elisabeth Snipes Spring
While the Norwegian Cyclone Model focuses on surface fronts, the Conveyor Belt Model provides a three-dimensional view of how air actually moves through a middle-latitude cyclone. It describes three distinct “streams” of air that transport heat and moisture, giving the storm its characteristic “comma” shape on satellite imagery.
1. The Warm Conveyor Belt (WCB)
This is the primary source of fuel for the storm.
- Origin: It begins at the surface in the tropical or subtropical regions (the “warm sector”).
- Path: It flows northward, parallel to the cold front. As it nears the center of the low, it rises over the cooler air of the warm front.
- Result: As the air rises and cools, it creates a massive band of clouds and heavy precipitation. On satellite, this forms the “tail” and the main body of the comma.
2. The Cold Conveyor Belt (CCB)
This stream stays closer to the surface for a longer period and is responsible for the “head” of the storm.
- Origin: It starts at the surface ahead (east) of the warm front, consisting of cold, dense air.
- Path: It flows westward toward the center of the low, passing underneath the Warm Conveyor Belt. As it approaches the low, it is pulled upward by the low pressure and rotates counterclockwise.
- Result: This creates the “comma head”—the region where the heaviest snowfall often occurs in winter storms.
3. The Dry Conveyor Belt (DCB)
This stream is the reason for the “dry slot” often seen behind a cold front.
- Origin: It originates high in the upper troposphere or even the lower stratosphere.
- Path: This cold, very dry air descends behind the cold front.
- Result: Because it is sinking, it brings clear skies. This creates a sharp contrast on satellite imagery, where a wedge of clear air (the dry slot) “eats into” the cloud mass near the center of the low.
The 3D Interaction
The interaction of these three belts determines the storm’s structure:
| Conveyor Belt | Moisture Level | Vertical Motion | Weather Contribution |
| Warm | High (Humid) | Strongly Rising | Clouds and widespread rain/snow. |
| Cold | Moderate | Rising near the Low | The “wrap-around” moisture and heavy snow. |
| Dry | Very Low | Sinking | The “dry slot” and clearing skies behind the front. |
Why It Matters
This model is essential for modern forecasting because it explains:
- Precipitation Distribution: Why the heaviest snow is usually to the north and west of the low center.
- Satellite Interpretation: Why storms look like commas from space.
- Storm Intensity: If the Dry Conveyor Belt descends too rapidly, it can lead to “stratospheric intrusions” that cause the storm to intensify into a bomb cyclone.
What was the storm of the century in 1993?
The 1993 Storm of the Century (also known as the ’93 Superstorm or the Great Blizzard of 1993) was one of the most intense and widespread middle-latitude cyclones in modern history. It is a textbook example of what happens when all the “ingredients” for cyclogenesis—extreme temperature gradients, jet stream support, and moisture—align perfectly.
The storm struck between March 12 and 14, 1993, affecting nearly half of the U.S. population across 26 states and stretching from Canada down to Central America.
Meteorological Profile
The storm was a “meteorological bomb,” characterized by its explosive intensification over the Gulf of Mexico before racing up the Eastern Seaboard.
- Central Pressure: It reached a minimum pressure of 960 mb in New England, comparable to a Category 3 hurricane.
- The “Three-Jet” Interaction: Unusually, the Arctic, Polar, and Subtropical jet streams merged over the Gulf of Mexico. This provided massive upper-level divergence (support), which “sucked” air upward at an incredible rate.
- Temperature Contrast: Bone-chilling Arctic air collided with tropical moisture from the Caribbean, creating a massive reservoir of potential energy.
Key Impacts
The storm was unique because it brought nearly every type of extreme weather simultaneously:
- Record Snowfall: Mount LeConte, Tennessee, recorded 56 inches of snow. Even the Deep South was buried, with Birmingham, Alabama, receiving 13 inches.
- The “White Hurricane”: Winds exceeded 100 mph in many areas. Mount Washington, New Hampshire, recorded a gust of 144 mph.
- Tornadoes and Derecho: A high-speed squall line produced a deadly derecho and 11 tornadoes across Florida, accompanied by a 12-foot storm surge.
- Economic Disruption: It was the first time in history that every major airport from Halifax to Tampa was closed at the same time.
Legacy in Forecasting
The 1993 Superstorm is considered a landmark event for the National Weather Service. It was the first major storm successfully predicted by numerical weather models five days in advance.
The accuracy of the forecast allowed for widespread blizzard warnings two days before the first snowflake fell, saving countless lives despite the storm’s unprecedented ferocity.
Comparison: 1993 Superstorm vs. Typical Nor’easters
| Feature | Typical Nor’easter | 1993 Superstorm |
| Geographic Reach | Mainly the Northeast U.S. | Gulf Coast to Canada (26 states). |
| Jet Support | Usually 1 or 2 jet streams. | Rare merger of 3 jet streams. |
| Primary Hazard | Heavy snow and coastal wind. | Blizzard, tornadoes, surge, and record cold. |
| Pressure Drop | Moderate intensification. | Explosive “bombogenesis” (960 mb). |
This video provides a detailed retrospective on the storm’s impact and how it forever changed the way meteorologists forecast extreme weather events.
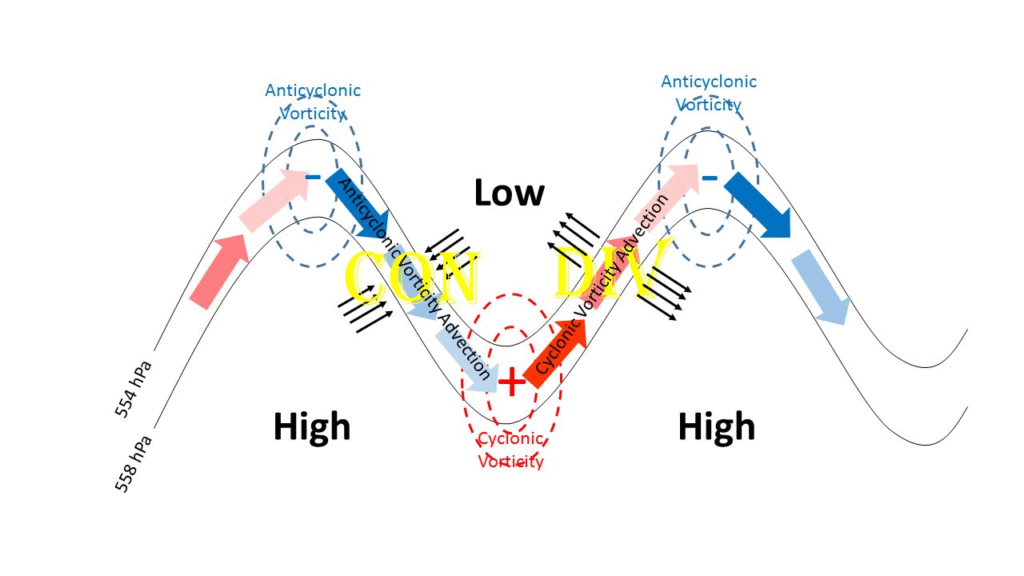
What is the role of vorticity?
vorticity is a measure of the “spin” or “rotation” of an air parcel. It is one of the most important variables for predicting the birth and intensification of middle-latitude cyclones because it is directly linked to vertical motion and pressure changes.
There are three types of vorticity to consider:
- Relative Vorticity (ζ): The spin caused by the wind’s own motion (curvature and shear).
- Earth Vorticity (f): The spin imparted by the Earth’s rotation (the Coriolis parameter).
- Absolute Vorticity (ζa): The sum of the two (ζ + f).
1. The Relationship Between Vorticity and Vertical Motion
The key to weather forecasting isn’t just knowing where the spin is, but how that spin is changing over time. This is known as Vorticity Advection.
- Positive Vorticity Advection (PVA): When the wind carries air with higher vorticity toward a region with lower vorticity. This occurs most strongly on the east side of an upper-level trough.
- The Result: PVA creates lifting in the atmosphere. It acts as a “pump” that sucks air from the surface, lowering the surface pressure and fueling a cyclone.
- Negative Vorticity Advection (NVA): When lower-vorticity air is moved into a region of higher vorticity. This occurs on the east side of an upper-level ridge.
- The Result: NVA creates subsidence (sinking air), which builds high-pressure systems and leads to clear, fair weather.
2. Shear vs. Curvature
Vorticity is created in two ways within the upper-level flow:
- Curvature Vorticity: Created when the wind follows a curved path (like the base of a trough).
- Shear Vorticity: Created when wind speeds change across a distance (like at the edges of a jet streak).
Even if the wind is blowing in a straight line, if the wind on the left is faster than the wind on the right, an air parcel will be forced to “tumble” or spin, creating vorticity.
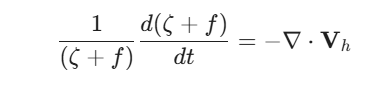
3. The Vorticity Equation
The mathematical foundation for how vorticity affects the growth of a storm is the Vorticity Equation. A simplified version for large-scale motion shows that the change in absolute vorticity over time is related to convergence and divergence:
Where:
- (ζ + f) is absolute vorticity.
- ∇ • V is horizontal divergence.
The Logic: If air at the top of the atmosphere spreads apart (divergence), the “vorticity” or spin of that air column must increase to maintain the balance. This is similar to a figure skater pulling their arms in to spin faster; as the air column is stretched vertically by divergence, the rotation intensifies.
4. Shortwaves: The “Vorticity Max”
Meteorologists often look for a Vorticity Maximum (or “Vort Max”) on a 500 mb map. These are small-scale ripples called shortwaves.
- When a “Vort Max” moves through a larger long-wave pattern, it provides a sudden burst of PVA.
- If this “Vort Max” moves over a surface front, it acts as the “spark” that triggers the development of a major storm.
How does a spinning planet create vorticity?
A spinning planet creates vorticity through a phenomenon known as the Coriolis effect. On a rotating sphere like Earth, the “spin” of the planet is physically transferred to the atmosphere, but the intensity of that spin depends entirely on where you are standing.
Here is how that planetary rotation translates into the atmospheric “swirl” we see in cyclones.
1. Earth Vorticity (Planetary Vorticity)
Because Earth rotates on its axis once every 24 hours, everything on its surface—including the air—possesses a certain amount of inherent spin. We call this Earth Vorticity ($f$).
The crucial factor is that Earth is a sphere, not a flat disk.
- At the Poles: You are spinning like a top around a vertical axis. Here, Earth vorticity is at its maximum.
- At the Equator: You are simply moving in a straight line around the center of the Earth; you have no vertical spin relative to the surface. Here, Earth vorticity is zero.
The mathematical value for this planetary spin is the Coriolis parameter:
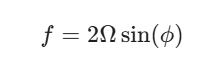
Where Ω is the Earth’s angular velocity and ϕ is the latitude. As your latitude (ϕ) increases, so does the “spin” provided by the planet.
2. The Conservation of Angular Momentum
When air moves across the planet, it tries to maintain its balance. If a parcel of air moves from the Equator (where it has no spin) toward the North Pole (where the planet is spinning rapidly), it suddenly finds itself “out of sync” with the ground beneath it.
To compensate for this change in latitude, the air must develop its own local rotation. This is similar to a figure skater:
- If air is stretched vertically (by divergence aloft), it must spin faster to conserve its angular momentum.
- If air is squashed (by convergence), its spin slows down.
3. Absolute Vorticity: The Grand Total
In the atmosphere, we care about the Absolute Vorticity (η), which is the sum of the planet’s spin and the air’s local “wiggle”:
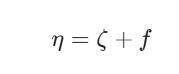
- ζ (Relative Vorticity): Spin caused by the wind blowing in curves or at different speeds (shear).
- f (Earth Vorticity): Spin provided by the planet’s rotation.
4. How this “Creates” Storms
The planet’s rotation provides the “background spin” necessary for weather systems to organize.
- The Kick: A disturbance (like a mountain range or a temperature contrast) creates a small amount of Relative Vorticity (ζ).
- The Organization: As air flows into a low-pressure zone, the Coriolis effect (f) deflects that air to the right (in the Northern Hemisphere).
- The Result: This deflection transforms a simple inward flow into the massive, counter-clockwise spiral of a middle-latitude cyclone. Without the planet’s rotation, air would simply rush straight into the center of a low, and the pressure would equalize instantly without ever forming a storm.
The “Rossby Wave” Connection
On a larger scale, the fact that f (planetary spin) changes with latitude is what creates Rossby Waves (the big “wiggles” in the jet stream). As air moves north, it gains planetary vorticity; to stay balanced, it must turn south and develop “negative” relative vorticity. This constant “balancing act” between the planet’s spin and the wind’s curve keeps the atmosphere in a state of perpetual wave-like motion.
What is the relationship between vorticity and long waves?
The relationship between vorticity and long waves (also known as Rossby waves) is defined by a fundamental principle called the Conservation of Absolute Vorticity. This principle explains why the jet stream moves in a wavy, undulating pattern rather than a straight line.
On a large scale, the atmosphere is constantly trying to balance the “spin” it gets from the Earth with the “spin” it creates through its own movement.
1. The Balancing Act
As we’ve discussed, Absolute Vorticity (η) is the sum of two parts:
- ζ (Relative Vorticity): The spin caused by the curvature of the wind.
- f (Planetary Vorticity): The spin provided by the Earth, which increases as you move toward the poles.
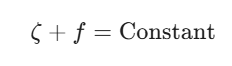
For long waves in the upper atmosphere, we assume that absolute vorticity remains roughly constant as an air parcel moves:
2. How the Wave Forms
Because the total spin must stay constant, any change in one type of vorticity must be offset by an equal and opposite change in the other.
- Moving Poleward (Northward): As air moves north, f (planetary spin) increases because the air is moving toward the axis of rotation. To keep the total constant, ζ (relative vorticity) must decrease. This forces the wind to curve clockwise, creating an Upper-Level Ridge.
- Moving Equatorward (Southward): As air moves south, f decreases. To compensate, ζ must increase. This forces the wind to curve counter-clockwise, creating an Upper-Level Trough.
3. The Rossby Parameter (β)
The “wavelength” and speed of these long waves are determined by the Rossby Parameter, denoted as $\beta$. This value represents the rate at which the Coriolis parameter ($f$) changes with latitude:
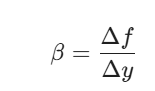
If the planet didn’t have a β effect (i.e., if it were a flat disk or a non-rotating body), long waves would not exist. The varying “spin” of the sphere is what provides the restoring force that keeps the air oscillating back and forth.
4. Why Long Waves Matter for Cyclones
The interaction between vorticity and long waves creates the environment where middle-latitude cyclones live:
- Trough to Ridge (East side of Trough): Here, the air is moving from an area of high vorticity (the trough) to low vorticity (the ridge). This creates Positive Vorticity Advection (PVA), which triggers the rising air and divergence needed for surface storms.
- Ridge to Trough (East side of Ridge): Air moves from low to high vorticity, creating Negative Vorticity Advection (NVA), which leads to sinking air and high-pressure systems.
5. Stationary vs. Moving Waves
- Long Waves: These are the massive, slow-moving (or even stationary) waves that dictate the general “weather regime” for a continent.
- Shortwaves: These are smaller ripples of vorticity embedded within the long waves. Because they have a much higher “curvature vorticity” (ζ), they move much faster and often act as the specific “trigger” that turns a long-wave trough into a major winter storm.
What is vorticity advection?
Understanding Vorticity Advection
Vorticity advection is the horizontal transport of “spin” (vorticity) by the wind. In simpler terms, it describes how areas of rotating air are moved from one location to another by the prevailing winds.
In the mid-latitudes, meteorologists primarily look at vorticity advection on 500 mb pressure maps (about 5,600 meters up) to identify where surface storms will strengthen or weaken.
The Two Main Types
Whether weather improves or worsens depends on the type of vorticity being moved into an area.
1. Positive Vorticity Advection (PVA)
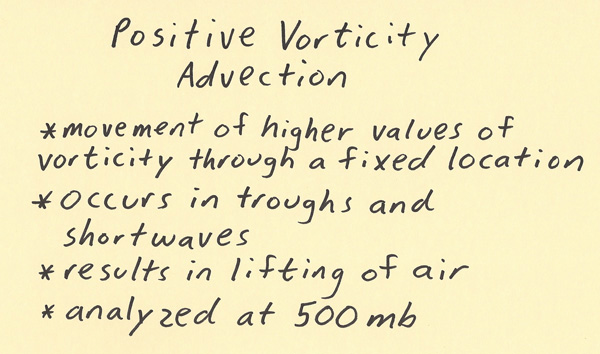
PVA occurs when air with higher (more cyclonic) vorticity is blown toward a region with lower vorticity.
- Location: This is typically found on the east side of an upper-level trough.
- Effect: PVA is the “exhaust” for the atmosphere. It forces air to rise, which leads to:
- Lowering surface pressure (strengthening a cyclone).
- Cloud formation and precipitation.
- Upper-level divergence.
2. Negative Vorticity Advection (NVA)
NVA occurs when air with lower (more anticyclonic) vorticity is moved into a region of higher vorticity.
- Location: This is typically found on the east side of an upper-level ridge.
- Effect: NVA acts like a “weight” on the atmosphere. It causes air to sink (subsidence), which leads to:
- Rising surface pressure (building a high-pressure system).
- Clearing skies and fair weather.
- Upper-level convergence.
Why Does It Cause Vertical Motion?
The link between advection and vertical motion is explained by the Quasi-Geostrophic (QG) Omega Equation.
Think of an air parcel as a figure skater. If that parcel is moving into a region where the environment is spinning faster (PVA), it must “keep up” with its surroundings. To increase its own spin to match the environment, the air parcel must converge at low levels and diverge at high levels. This vertical “stretching” of the air column forces the air between those levels to rise.
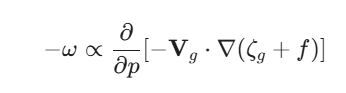
This mathematical relationship shows that when the advection of absolute vorticity (-Vg • ∇η) increases with height, it forces upward vertical motion (ω).
The “Vort Max”
On a weather map, you will often see “X” marks or colorful blobs representing a Vorticity Maximum (Vort Max).
- Ahead of the Vort Max: This is the region of PVA. If you are downwind of a Vort Max, a storm is likely approaching.
- Behind the Vort Max: This is the region of NVA. Once the “Vort Max” passes over you, the weather usually begins to clear up.
Vorticity Advection and Vertical Motion
This video provides a visual walkthrough of how vorticity advection is plotted on weather maps and its direct physical impact on vertical air motion.
What was Toronto’s snowstorm of the century?
In Toronto’s history, two different events are often debated for the title of “Snowstorm of the Century,” depending on whether you value a single day of chaos or an entire month of relentless accumulation.
1. The Great Blizzard of 1944 (The Single-Event Record)
On December 11, 1944, Toronto was hit by a massive storm that remains the most significant single-day snowfall in the city’s recorded history.
- The Totals: Over 57 cm (22.5 inches) of snow fell in just two days, with 48 cm falling on the first day alone.
- The Impact: The city was completely paralyzed. This was during WWII, and even ammunition factories—essential to the war effort—had to shutter because workers couldn’t reach them.
- The Severity: Visibility was zero, and 21 people died, many from the physical exertion of shoveling the heavy, wet snow.
2. The January 1999 “Snowmageddon” (The Military Intervention)
While 1944 holds the record for a single storm, January 1999 is more famous in modern memory due to the sheer volume of snow that fell over two weeks.
- The Totals: A series of four major storms dumped nearly 118 cm (almost 4 feet) on the city in less than 15 days.
- The Controversy: Mayor Mel Lastman famously called in the Canadian Army to help clear the streets. Over 400 soldiers arrived in armored vehicles (Bisons) to help clear catch basins and transport the sick to hospitals because ambulances were getting stuck.
- The Legacy: This event led to Toronto being teased by the rest of Canada as “winter weather wimps,” but the accumulation was so extreme that there was simply no place left to pile the snow.
Comparison: 1944 vs. 1999
| Feature | December 1944 | January 1999 |
| Type of Event | Single, massive blizzard. | Series of relentless storms. |
| Max 24hr Snow | 48 cm | ~40 cm |
| Total Accumulation | 57 cm | 118 cm |
| Unique Factor | Shut down WWII factories. | Required military intervention. |
Recent Update: January 2026
Just this past January, Toronto experienced another monster storm that dropped 46 cm at Pearson Airport and up to 56 cm downtown in a single day. While it broke daily records at the airport, it didn’t quite reach the total cumulative “misery” of 1999 or the sheer 24-hour weight of 1944.
Toronto’s historic 1999 snowstorm
This video provides a look back at the infamous moment in 1999 when the military was brought in, showing the scale of the snow banks that paralyzed the city.
What are tropical-extratropical linkages?
tropical-extratropical linkages describe the physical processes and “bridges” that allow weather patterns in the tropics to directly influence, or even create, weather events in the middle and high latitudes.
The atmosphere does not function in isolated boxes; instead, it uses global-scale circulations to move heat and moisture from the “surplus” at the equator to the “deficit” at the poles.
1. The Atmospheric Bridge (Teleconnections)
The most common linkage is the atmospheric bridge, where a change in tropical sea surface temperatures (SSTs) triggers a chain reaction that shifts the jet stream thousands of miles away.
- ENSO (El Niño/La Niña): When the central Pacific warms (El Niño), it creates massive thunderstorms that pump energy into the upper atmosphere. This “pushes” the Pacific Jet Stream further south and makes it more zonal (straight), often leading to stormier winters in the southern U.S. and milder winters in Western Canada.
- Madden-Julian Oscillation (MJO): This is a 30- to 60-day ripple of tropical rain. As this “blob” of convection moves eastward, it sends out Rossby Wave trains—large-scale atmospheric ripples—that can trigger a “blocking” high-pressure system or a deep trough in the mid-latitudes weeks later.
2. Moisture Conveyor Belts (Atmospheric Rivers)
One of the most direct linkages is the physical transport of water vapor.
- Atmospheric Rivers: These are narrow, concentrated “rivers” of moisture that originate in the tropics (like the “Pineapple Express” from Hawaii).
- Fueling Storms: When a mid-latitude cyclone’s cold front intercepts one of these tropical moisture plumes, the storm’s intensity can skyrocket. The release of latent heat from the condensing tropical moisture provides extra energy to the cyclone, often turning a standard low into a major flood event.
3. Extratropical Transition (ET)
This is a specific event where a tropical system becomes an extratropical one.
- The Process: A hurricane or tropical storm moves north and encounters the jet stream and a sharp temperature gradient (baroclinic zone).
- The Transformation: The storm loses its symmetric “warm-core” and develops fronts, becoming a “cold-core” mid-latitude cyclone.
- The Impact: These systems are particularly dangerous because they can expand in size as they transition, bringing tropical-strength rainfall and hurricane-force winds to regions like the Canadian Maritimes or Western Europe (e.g., Hurricane Hazel in Toronto or Storm Ophelia in Ireland).
4. The “Oceanic Tunnel”
While the atmosphere reacts in days, the ocean reacts over years.
- Subsurface ocean currents can carry thermal anomalies from the mid-latitudes back to the tropics (and vice-versa) over long periods.
- This “tunneling” helps regulate long-term climate cycles and can influence how intense tropical seasons will be based on extratropical conditions from the previous year.
Summary of Linkages
| Mechanism | Primary Driver | Weather Result |
| Atmospheric Bridge | Jet stream shifts (Rossby waves). | Changes in storm tracks and seasonal temperature. |
| Atmospheric Rivers | Low-level moisture transport. | Extreme precipitation and flooding. |
| ET (Transition) | Tropical systems merging with the jet. | Expansion of storm fields into high latitudes. |
| Hadley Cell | Large-scale vertical circulation. | The physical “lifting” of tropical air that then descends in the subtropics. |
What are polar lows?
Polar lows are intense, small-scale (mesoscale) maritime cyclones that form in high-latitude regions poleward of the main polar front. Often referred to as “Arctic hurricanes,” they are notorious for their rapid development, hurricane-force winds, and heavy, blinding snow.
While they share some characteristics with the middle-latitude cyclones we have been discussing, they are distinct in their scale, energy sources, and life cycles.
1. Key Characteristics
- Size: They are much smaller than standard mid-latitude cyclones, typically ranging from 200 to 1,000 km in diameter (compared to the 2,000+ km of a typical storm).
- Speed of Development: They can “explode” into existence in just a few hours and usually last only 12 to 36 hours.
- Environment: They form exclusively over open water during Marine Cold Air Outbreaks (MCAOs), where frigid air from ice-covered land or sea ice flows over relatively “warm” ocean water.
2. Physical Structure: Comma vs. Spiral
On satellite imagery, polar lows typically display one of two structures:
- Spiraliform (Hurricane-like): These have a symmetric cloud pattern and sometimes even a clear “eye.” These are driven heavily by convection and latent heat release from the sea surface.
- Comma-shaped: These look like miniature versions of mid-latitude cyclones and are driven more by baroclinic instability (temperature gradients).
3. The Energy Source: A Hybrid System
Polar lows are unique because they often draw energy from two different sources at once:
- Baroclinic Instability: Like mid-latitude cyclones, they utilize the sharp temperature contrast between the ice/land and the open ocean.
- Convective Instability: Like tropical hurricanes, they are fueled by sensible and latent heat fluxes from the water. When the freezing air meets the warm water, it becomes extremely unstable, leading to deep convection (thunderstorms) that powers the storm’s rotation.
4. Vertical Structure and “Upper-Level Support”
Just like their larger cousins, polar lows require a specific vertical setup to thrive:
- Cold Core: Unlike tropical hurricanes, which are warm-cored, polar lows have a cold-core structure in their upper levels.
- The “Trigger”: They are often “sparked” by an upper-level vorticity maximum or a cold pool moving over the unstable maritime air.
- Lower Height: Because the cold polar atmosphere is much “shallower” than the tropical atmosphere, the circulation of a polar low usually only extends to about 5 km in height (the 500 mb level), whereas a mid-latitude cyclone or hurricane can reach 10–15 km.
5. Why They Are Dangerous
- Forecasting Difficulty: Because of their small size and maritime origin, they often slip between the grid points of standard weather models.
- Rapid Onset: Surface winds can jump from a light breeze to over 100 km/h in less than 10 minutes.
- Blizzard Conditions: They produce intense “snow squalls” that can reduce visibility to zero almost instantly, making them a major hazard for shipping, offshore oil rigs, and coastal communities.
Summary: Polar Lows vs. Mid-Latitude Cyclones
| Feature | Polar Low | Mid-Latitude Cyclone |
| Diameter | 200–1,000 km | 1,000–3,000 km |
| Lifespan | 12–36 hours | 3–7 days |
| Energy Source | Convection + Baroclinicity | Primarily Baroclinicity |
| Location | Maritime (near sea ice/poles) | Global (mid-latitudes) |
| Vertical Depth | ~5 km (Shallow) | ~12 km (Deep) |
What are atmospheric rivers in the Northeast Pacific?
CBS 8 San Diego
In the Northeast Pacific, atmospheric rivers (ARs) are long, narrow filaments of concentrated moisture that act as a “conveyor belt,” transporting water vapor from the tropics toward the West Coast of North America.
While they occur globally, the Northeast Pacific variety is famous for its role in the water cycle of British Columbia, Washington, Oregon, and California.
1. The “Pineapple Express”
The most recognizable type of AR in this region is the Pineapple Express.
- Origin: It taps into a deep moisture reservoir near Hawaii.
- Mechanism: A strong, southern branch of the jet stream creates a “fire hose” effect, aiming this tropical moisture directly at the coast.
- Impact: Because the air is tropical, it is much warmer than a typical winter storm. When it hits the mountains, it can drop torrential rain even at high elevations, causing rapid snowmelt and catastrophic flooding.
2. Physical Structure and Scale
- Dimensions: These plumes are typically 400 to 600 kilometers wide and can stretch for thousands of kilometers across the Pacific.
- Water Flux: A single strong atmospheric river can carry a flow of water vapor equivalent to 15 times the average discharge of the Mississippi River.
- The AR Scale: Much like the Saffir-Simpson scale for hurricanes, ARs are rated from AR1 to AR5:
- AR1 & AR2: Primarily beneficial; they provide critical water supply and snowpack.
- AR4 & AR5: Primarily hazardous; they cause extreme flooding, landslides, and infrastructure damage.
3. The Orographic Effect
The reason ARs are so intense in the Northeast Pacific is due to the Coast Mountains and the Sierra Nevada.
- As the moisture-laden air hits these vertical barriers, it is forced upward (orographic lift).
- The air cools rapidly, causing the massive amount of water vapor to condense and fall as “orographic rain” or snow.
- This results in some of the highest precipitation totals on the continent (sometimes over 250 mm in 24 hours).
4. Recent and Current Activity (2025–2026)
The winter of 2025–2026 has been particularly active for Northeast Pacific atmospheric rivers:
- December 2025: A Category 5 AR struck British Columbia and Washington, dropping up to 10 inches of rain in a week and forcing evacuations for over 100,000 people.
- February 2026: A long-duration system impacted the Oregon and California coast ranges, leading to significant stream rises and “rain-on-snow” events.
- Current Status (March 12, 2026): Multiple systems continue to impact the Pacific Northwest, bringing several feet of snow to the Cascades but also raising avalanche concerns due to high winds and a brief mid-week warm-up.
Summary of Impacts
| Benefit | Hazard |
| Ends Drought: Responsible for ending 60–74% of persistent droughts in the West. | Flooding: Associated with 80% of all major flood damage on the West Coast. |
| Snowpack: Provides 30–50% of the annual snowpack in the Sierra Nevada and Cascades. | Mudslides: Intense rain on saturated soil often triggers debris flows and landslides. |
| Hydro Power: Fills reservoirs necessary for the Pacific Northwest’s energy grid. | Infrastructure: High-intensity ARs can cost over $1 billion in damage annually. |
What is the pineapple express?
The Pineapple Express is a specific, non-technical name for a powerful atmospheric river that originates in the tropical waters around Hawaii and “barrels” toward the West Coast of North America.
While atmospheric rivers occur globally, this version is famous for its distinct tropical source and its ability to cause massive flooding and rapid snowmelt in the Pacific Northwest and California.
1. How the “Express” Works
The system acts like a high-altitude fire hose. It requires a very specific setup in the upper atmosphere to function:
- The Moisture Source: Warm, humid air builds up in the tropics near Hawaii (where pineapples grow).
- The Jet Stream: A strong, southern branch of the polar jet stream dips down and “snags” this moisture, carrying it thousands of miles across the ocean.
- The Trigger: Often, the Madden-Julian Oscillation (MJO)—a ripple of tropical rainfall—helps push this moisture into the mid-latitudes, where it hitches a ride on the jet stream.
2. Why It is Unique (and Dangerous)
Most winter storms in the mid-latitudes are “cold-core” systems that bring snow. The Pineapple Express is different because it is exceptionally warm and moist.
- Rain-on-Snow Events: Because the air is tropical, the freezing level rises significantly (sometimes above 3,000 meters). This causes heavy rain to fall on top of existing mountain snowpacks, causing the snow to melt instantly and triggering catastrophic flooding.
- Orographic Lift: When this moisture-laden air hits the Coast Mountains or the Sierra Nevada, it is forced upward. This cools the air rapidly, squeezing out torrential amounts of rain—sometimes more than 250 mm (10 inches) in a single day.
- Massive Water Transport: A strong Pineapple Express can carry an amount of water vapor equivalent to 15 times the flow of the Mississippi River.
3. Recent Activity (Winter 2025–2026)
The current winter season has seen several high-impact Pineapple Express events, despite an overall La Niña pattern which typically makes these events less frequent in the southern regions.
- December 2025: A massive system slammed into Washington and British Columbia, leading to widespread evacuations and record-breaking river levels. Over 100,000 people were under flood alerts as freezing levels soared during the storm.
- Christmas 2025: Southern California experienced one of its wettest holidays in decades as a Pineapple Express brought 4 to 8 inches of rain to the mountains, creating significant mudslide risks.
- January 2026: British Columbia saw another round of saturation, with Chilliwack recording over 100 mm of rain in a three-day window due to a moisture plume that emanated directly from the Hawaiian Islands.
4. Benefits vs. Hazards
While the name sounds whimsical, it is a double-edged sword for the West Coast’s water cycle:
| Hazards | Benefits |
| Flooding: Causes 80% of major flood damage on the West Coast. | Water Supply: Provides 30–50% of the annual precipitation for CA/OR/WA. |
| Mudslides: Intense rain on saturated soil triggers debris flows. | Drought Relief: Historically responsible for ending most long-term droughts. |
| Avalanches: Rapid warming and heavy snow/rain destabilize the pack. | Snowpack: Essential for filling reservoirs used for hydro-power. |
This video explains the meteorological mechanics behind how the jet stream dips into the tropics to “express” moisture directly to the coastline.
Solved Problems
here is a collection of high-level practical application problems covering cyclogenesis, jet stream dynamics, vorticity, and the conveyor belt model. These problems are designed to simulate the decision-making process of a professional meteorologist or atmospheric researcher.
Section 1: Cyclogenesis & Vertical Structure
1. The Mass Balance Problem
- Problem: A surface low has central convergence of 2.5 * 10-5 s-1. At the 300 mb level directly above, the divergence is 2.0 * 10-5 s-1. Will the central pressure of the surface low rise or fall?
- Solution: The central pressure will rise. For a low to deepen (pressure to fall), upper-level divergence must be greater than surface convergence. Since air is flowing in at the bottom faster than it is being exhausted at the top, mass is being added to the column.
2. The Westward Tilt Diagnosis
- Problem: You are analyzing a weather system where the 500 mb trough axis is located directly over the surface low center. What is the likely life-cycle stage of this cyclone?
- Solution: The cyclone is in the occluded or dissipating stage. For a cyclone to develop, it must tilt westward with height. When it becomes “vertically stacked,” the upper-level divergence is no longer positioned to exhaust the surface convergence, and the system “fills” and weakens.
3. The Baroclinic Fuel Check
- Problem: A cyclone is moving from a region with a horizontal temperature gradient of 2°C/100 km into a region with 8°C/100 km. How will the storm’s kinetic energy change?
- Solution: The storm will likely intensify. Middle-latitude cyclones derive energy from baroclinic instability (temperature contrasts). A tighter gradient increases the available potential energy that can be converted into the kinetic energy of the wind.
Section 2: Jet Stream & Jet Streak Dynamics
4. The Jet Streak Quadrant Strategy
- Problem: A surface low is positioned under the right-exit region of a 300 mb jet streak. Should you forecast intensification or weakening?
- Solution: Weakening. The right-exit and left-entrance regions are areas of upper-level convergence and sinking air (subsidence). This “pushes down” on the surface low, increasing the pressure.
5. Identifying the “Bomb” Potential
- Problem: A surface low moves under the left-exit region of a powerful jet streak where winds reach 150 knots. The pressure is currently 1000 mb. What is the risk over the next 24 hours?
- Solution: There is a high risk of bombogenesis (a “bomb cyclone”). The left-exit region provides maximum divergence. If the pressure drops ≥ 24 mb in 24 hours, it meets the criteria for a bomb.
6. The Jet Stream Seasonality
- Problem: Why are Alberta Clippers generally faster-moving and more frequent in January than in July?
- Solution: In winter, the meridional temperature gradient between the pole and equator is much sharper. This increases the speed of the jet stream, which acts as the steering mechanism and energy source for these clippers.
Section 3: Vorticity & Long Waves
7. Vorticity Advection Forecasting
- Problem: A 500 mb map shows a “Vort Max” (vorticity maximum) moving toward your location. The winds are blowing from the Vort Max toward you. What weather should you expect?
- Solution: Deteriorating weather (clouds and precipitation). You are in a region of Positive Vorticity Advection (PVA), which triggers large-scale lifting of air.
8. The Rossby Wave Conservation
- Problem: A parcel of air in the jet stream moves from 30°N to 50°N. To conserve absolute vorticity (ζ + f = const), what must happen to its relative vorticity (ζ)?
- Solution: Its relative vorticity must decrease (become more anticyclonic). Since f (planetary spin) increases as you move north, the air must curve clockwise to balance the total spin, often forming a ridge.
9. Shortwave vs. Longwave
- Problem: You see a broad, stationary trough over the Pacific (longwave) and a small, fast-moving ripple moving through it (shortwave). Which one is the “trigger” for a specific 24-hour rain event?
- Solution: The shortwave. Longwaves set the seasonal “mood,” but shortwaves provide the localized vorticity advection necessary to spark individual storm systems.
Section 4: The Conveyor Belt Model
10. Locating the “Dry Slot”
- Problem: On a water vapor satellite image, you see a dark wedge of very dry air “eating” into the comma head of a cyclone. Which conveyor belt is responsible?
- Solution: The Dry Conveyor Belt (DCB). This is cold, dry air descending from the upper troposphere/lower stratosphere behind the cold front.
11. The Heavy Snow Zone
- Problem: In a classic winter cyclone, where would you expect the heaviest, most persistent snowfall: in the Warm Conveyor Belt or the Cold Conveyor Belt?
- Solution: The Cold Conveyor Belt (CCB). While the WCB produces widespread rain/clouds, the CCB wraps around the north side of the low (the “comma head”), where it stays cold enough for heavy snow.
Section 5: Tropical-Extratropical Linkages
12. The Pineapple Express Flood Risk
- Problem: An atmospheric river is aimed at the Coast Mountains with a freezing level of 2,500 meters. The mountain snowpack starts at 1,000 meters. Why is this a major flood threat?
- Solution: This is a rain-on-snow event. The tropical warmth of the Pineapple Express will melt the existing snowpack while adding heavy rain on top of it, creating massive runoff that the soil cannot absorb.
13. Extratropical Transition (ET)
- Problem: A hurricane is moving north and its cloud shield is becoming asymmetric, looking more like a “comma” than a circle. What is happening?
- Solution: It is undergoing Extratropical Transition. It is losing its tropical “warm core” and beginning to draw energy from baroclinic temperature gradients (becoming a mid-latitude cyclone).
Section 6: Advanced Meteorological Calculations
14. The Coriolis Parameter (f)
- Problem: Calculate the Coriolis parameter for Calgary (51°N) given Ω = 7.29 * 10-5 rad/s.
- Solution:

15. Rossby Number Application
- Problem: A weather system has a characteristic wind speed of 20 m/s and a length scale of $1,000\text{ km}$. Is this system’s motion dominated by Earth’s rotation?
- Solution: Calculate the Rossby Number (Ro = U / fL):
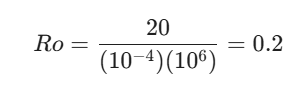
Since Ro < 1, the Coriolis force is dominant, and the system will be highly organized by the Earth’s rotation.
16. Continuity Equation and Rising Air
- Problem: If you have horizontal convergence (∇ • V < 0) in the lower 2 km of the atmosphere, what is the sign of the vertical velocity (w) at 3 km?
- Solution: The sign is positive (rising air). According to the continuity equation, if air is being pushed together at the bottom, it must be pushed up to conserve mass.
Section 7: Historical & Polar Cases
17. The 1993 Superstorm Synergy
- Problem: Why did the 1993 “Storm of the Century” develop so much more intensely than a standard Nor’easter?
- Solution: It featured a rare triple-jet merger. The Arctic, Polar, and Subtropical jet streams combined, providing an unprecedented amount of upper-level divergence (exhaust) over the developing surface low.
18. Polar Low Identification
- Problem: A small (400 km) spiral storm forms over the open Barents Sea during a cold air outbreak. It has an “eye” but is cold-cored aloft. Is this a hurricane?
- Solution: No, it is a Polar Low. While it looks like a hurricane, it is much smaller and relies on a mix of baroclinic instability and convective heat fluxes from the sea.
19. The Toronto 1999 “Snowmageddon”
- Problem: Why did Toronto require the military in 1999 if no single storm broke the all-time 24-hour record?
- Solution: It was a frequency and accumulation problem. Four major storms hit in rapid succession, preventing the city from clearing snow between events, leading to a total “storage” failure where there was literally no place left to put the snow.
20. The Ageostrophic Wind in Jet Streaks
- Problem: In the entrance region of a jet streak, the wind is “ageostrophic” and blows toward lower pressure. How does this affect the vertical circulation?
- Solution: This creates the indirect thermal circulation. It forces air to sink in the left-entrance and rise in the right-entrance, which is why the right-entrance is a “sweet spot” for storm development.