
Meteorology Today Second Canadian Edition
Earth and Atmospheric Sciences
In meteorology, stability refers to the atmosphere’s tendency to either resist or encourage vertical motion. Think of it as the atmosphere’s “stiffness.”
Whether a cloud becomes a flat, thin sheet or a towering thunderstorm depends entirely on the temperature relationship between a rising parcel of air and the air surrounding it.
The Core Concept: Density and Buoyancy
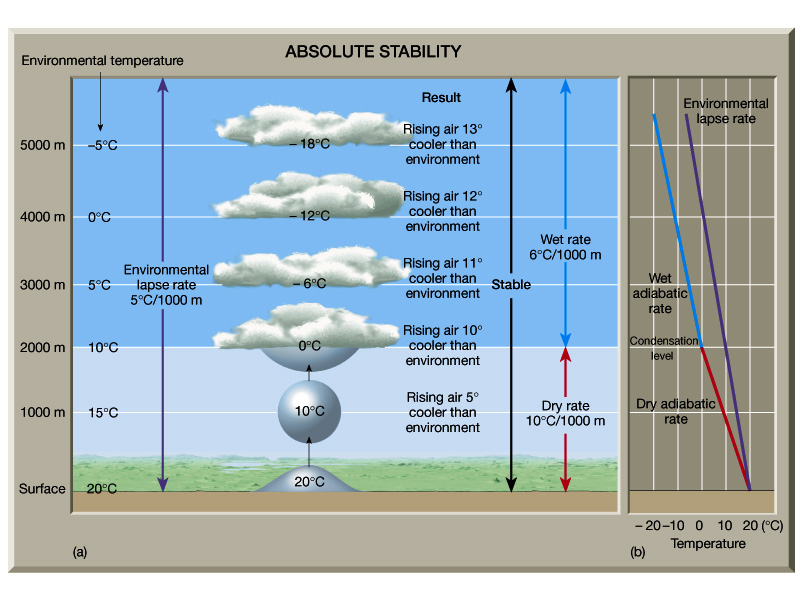
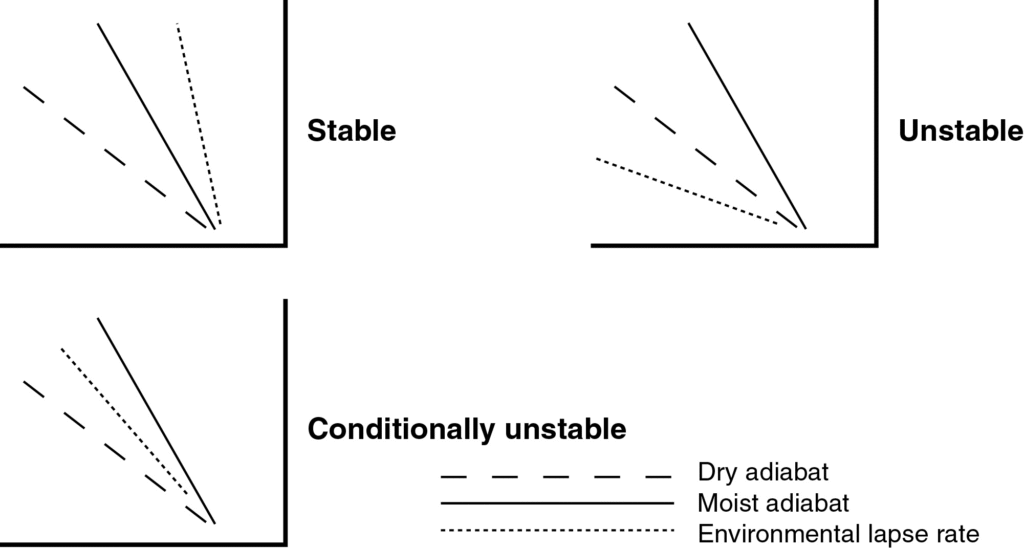
Stability is governed by the Adiabatic Lapse Rate (how much a rising parcel of air cools) versus the Environmental Lapse Rate (how much the actual atmosphere cools with height).
- Stable Air: If a rising parcel of air becomes colder (and denser) than the air around it, it will sink back to its original position. It resists upward movement.
- Unstable Air: If a rising parcel stays warmer (and less dense) than the surrounding air, it will continue to rise like a hot air balloon.
How Stability Suppresses Cloud Development
When the atmosphere is stable, vertical growth is stifled. This usually happens during a temperature inversion, where warm air sits on top of cold air.
- Cloud Type: If clouds form at all, they are stratiform (flat, featureless, and layered).
- Appearance: Think of a gray, overcast “high-noon” sky or low-hanging fog.
- Weather: Expect steady drizzle or light rain, but no turbulence or lightning.
- The “Lid” Effect: Stable air acts like a ceiling, spreading moisture horizontally rather than letting it build upward.
How Instability Enhances Cloud Development
When the atmosphere is unstable, the “brakes” are off. This typically occurs when the air near the ground is very warm and moist, while the air aloft is very cold.
- Cloud Type: This leads to cumuliform clouds (puffy, cotton-ball shapes) or cumulonimbus (thunderheads).
- Appearance: Towering clouds with deep vertical relief and “cauliflower” tops.
- Weather: This is the recipe for convective storms, heavy downpours, hail, and lightning.
- Vertical Velocity: In highly unstable environments, updrafts can reach speeds of over 100 mph, carrying moisture high into the troposphere where it freezes into ice and hail.
Summary Comparison
| Feature | Stable Atmosphere | Unstable Atmosphere |
| Vertical Motion | Resisted (Sinking) | Encouraged (Rising) |
| Cloud Shape | Flat/Layered (Stratus) | Towering/Puffy (Cumulus) |
| Precipitation | Steady/Light | Showery/Heavy |
| Visibility | Generally poor (haze/fog) | Generally good (outside of rain) |
| Turbulence | Smooth flying | Bumpy/Violent |
What is atmospheric stability?
At its simplest, atmospheric stability is the atmosphere’s resistance to vertical motion. It determines whether a “parcel” of air (a localized bubble of air) will stay put, sink back down, or rocket upward to form a storm.
Think of it like a ball in a landscape:
- Stable: A ball at the bottom of a bowl. If you push it up, it rolls back to the center.
- Unstable: A ball balanced on top of a hill. If you give it a tiny push, it accelerates away.
The Role of Temperature and Density
Stability is governed by the relationship between the temperature of a rising air parcel and the temperature of the surrounding environment.
- Rising Air Cools: As air rises, pressure drops, the air expands, and its temperature falls (this is called adiabatic cooling).
- The Comparison: * If the rising air becomes colder (and thus heavier) than the air around it, it sinks. This is Stable Air.
- If the rising air remains warmer (and thus lighter) than the air around it, it keeps rising. This is Unstable Air.
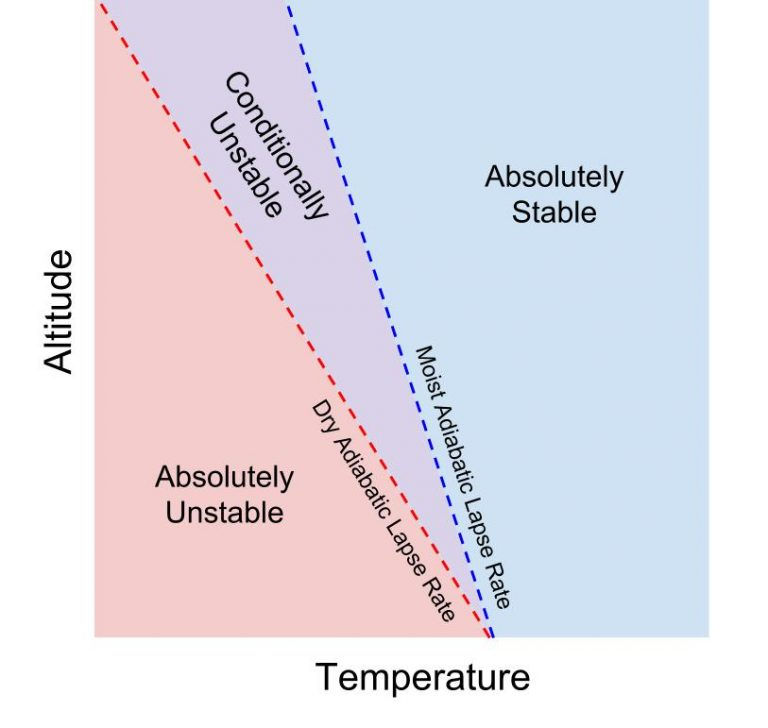
The Three States of Stability
Meteorologists categorize the sky into three primary states based on the Lapse Rate (the rate at which temperature changes with altitude):
1. Absolute Stability
The air is “stiff.” Even if you force air upward (like over a mountain), it will be cooler than its surroundings and want to sink back down.
- Visual clue: Clear skies or flat, sheet-like stratus clouds.
- Air Quality: Often poor, as smoke and pollutants get trapped near the ground.
2. Absolute Instability
The air is “buoyant.” The surrounding atmosphere cools very rapidly with height. Once a bubble of air starts moving up, it stays warmer than the environment and continues to rise indefinitely.
- Visual clue: Towering cumulonimbus clouds (thunderstorms).
- Weather: Violent updrafts, heavy rain, and gusty winds.
3. Conditional Instability
This is the most common state. The air is stable when it’s dry, but if it becomes saturated (reaches 100% humidity) and forms a cloud, it becomes unstable.
- The “Trigger”: It needs a push to get started—like a cold front or a mountain—to reach the point where it becomes buoyant on its own.
Why It Matters
Stability acts as the “gatekeeper” for weather. Without instability, we wouldn’t have the vertical lift necessary for significant rainfall or the dispersion of heat from the Earth’s surface into the upper atmosphere.
How is stability determined?
To determine stability, meteorologists compare two different temperature changes: how a rising bubble of air (a parcel) cools versus how the actual surrounding atmosphere (the environment) cools with height.
The “winner” of this temperature contest determines if the air stays down or rockets upward.
1. The Environmental Lapse Rate (ELR)
This is the “real-world” temperature of the sky at a specific moment. It isn’t a fixed number; it changes based on the day, the time, and the weather front moving through.
- Measurement: It is measured by launching a radiosonde (a weather balloon) that sends back data on temperature and pressure as it climbs.
2. The Adiabatic Lapse Rates (The “Parcel” Rules)
When a parcel of air rises, it expands and cools automatically due to lower pressure. This cooling happens at two very specific, predictable rates:
- Dry Adiabatic Lapse Rate (DALR): If the air is unsaturated (no cloud has formed), it cools at a constant rate of 10°C per kilometer.
- Moist Adiabatic Lapse Rate (MALR): If the air is saturated (a cloud has formed), condensation releases “latent heat.” This heat fights against the cooling, so the parcel cools more slowly—roughly 6°C per kilometer.
3. The Comparison (The Stability Test)
By plotting the ELR against the DALR/MALR, we can determine the stability of the air:
| If the Environment… | Stability Type | Result |
| Cools slower than 6°C/km | Absolutely Stable | The rising parcel will always be colder/heavier than its surroundings. It sinks. |
| Cools faster than 10°C/km | Absolutely Unstable | The rising parcel will always be warmer/lighter than its surroundings. It rises. |
| Cools between 6°C and 10°C/km | Conditionally Unstable | The air is stable while dry, but if it becomes saturated (forms a cloud), it becomes unstable and starts to rise. |
4. Visualizing the “Lift”
The most common way professionals visualize this is through a Skew-T Log-P Diagram. It looks like a chaotic mess of lines to the untrained eye, but it’s essentially a map:
CAPE: The area between these lines is called CAPE (Convective Available Potential Energy). The bigger the area, the more “fuel” there is for a massive thunderstorm.
Trace the Parcel: Follow the line of how a parcel should cool.
Look for the Gap: If the parcel line is to the right of the environmental line, the parcel is warmer than the sky.
What is a stable atmosphere?
A stable atmosphere is one that actively resists vertical motion. If a bubble of air (a parcel) is pushed upward—by a gust of wind or a mountain—it will quickly become cooler and denser than the air surrounding it, causing it to sink back down to its original level.
In a stable environment, the “lid” is on. The atmosphere acts like a shock absorber, dampening any attempts at cloud growth or storm formation.
The Recipe for Stability
Stability occurs when the Environmental Lapse Rate (the actual temperature of the sky) cools very slowly with height, or even warms up.
There are two primary ways the atmosphere becomes stable:
1. Surface Cooling
If the ground cools down (like on a clear night), it chills the air directly above it. This creates a layer of cold, dense air trapped underneath warmer air.+1
- Result: Since the cold air is already at the bottom, it has no reason to rise.
2. Temperature Inversions
An inversion is the “ultimate” stable condition. Normally, air gets colder as you go up, but in an inversion, it actually gets warmer.
- The “Cap”: Rising air parcels hit this warm layer and immediately become “heavier” (relatively colder) than the air around them, stopping their ascent instantly.
Visual and Weather Characteristics
You can often tell the atmosphere is stable just by looking at the horizon. Because the air isn’t moving vertically, everything gets “squashed” horizontally.
- Cloud Types: If moisture is present, you get Stratus clouds. These are flat, featureless layers that look like a gray blanket.
- Visibility: Generally poor. Because there is no vertical mixing, dust, smoke, and pollutants stay trapped near the ground (haze or smog).
- Precipitation: If it rains, it’s usually a steady, consistent drizzle rather than a sudden downpour.
- Flight Conditions: Pilots love stable air because it is smooth. There are no updrafts or downdrafts to cause turbulence.
Absolute vs. Probable Stability
In technical terms, we call an atmosphere Absolutely Stable when the environmental cooling rate is less than both the Dry and Moist Adiabatic Lapse Rates.
ELR < 6°C/km
Even if a cloud forms and releases “latent heat,” it still can’t get warm enough to overcome the surrounding environment. It is destined to stay flat.
What is the radiosonde?
A radiosonde is a battery-powered telemetry instrument package carried into the atmosphere, usually by a weather balloon, to measure vertical profiles of the physical properties of the air.
If stability is the “math problem” of the atmosphere, the radiosonde is the device that collects the raw data needed to solve it.
How It Works
As the balloon rises (often reaching altitudes of over 100,000 feet), the radiosonde sensors continuously measure specific variables. This data is transmitted back to a ground receiver via radio waves in real-time.
Key Measurements
The “mandatory” data points a radiosonde collects include:
- Temperature: To determine the Environmental Lapse Rate.
- Humidity: To find the dew point and determine if clouds will form.
- Pressure: To track the altitude of the instrument.
- GPS/Wind: By tracking the position of the sonde as it drifts, meteorologists calculate wind speed and direction at different heights.
The Data Output: The Sounding
The data gathered by a radiosonde is plotted on a complex meteorological chart called a Skew-T Log-P diagram (or simply a “sounding”).
By looking at a sounding, a forecaster can see exactly where the air is stable or unstable. For example, if the temperature line suddenly moves to the right (gets warmer) as altitude increases, the radiosonde has detected a temperature inversion.
Why Radiosondes are Essential
While satellites are great for a “top-down” view, they struggle to measure the exact temperature of thin layers of air deep in the atmosphere. Radiosondes provide a precise “slice” of the sky.
- Global Coordination: Twice a day (at 0000 UTC and 1200 UTC), over 800 locations worldwide launch balloons simultaneously. This provides a “snapshot” of the global atmosphere.
- Storm Prediction: They identify CAPE (convective energy) and wind shear, which are the primary ingredients for tornadoes and severe thunderstorms.
- Aviation: They help pilots identify where turbulence or icing is likely to occur.
What Happens to the Balloon?
As the balloon rises, the air pressure outside decreases, causing the balloon to expand. Eventually, it grows to the size of a small house and bursts. A small orange parachute then deploys to slow the radiosonde’s descent to Earth.
Fun Fact: Most radiosondes are “one-way” trips, but they often include a mailing bag. if you find one in a field, you can follow the instructions to mail it back to the National Weather Service for refurbishment!
What are subsidence inversions?
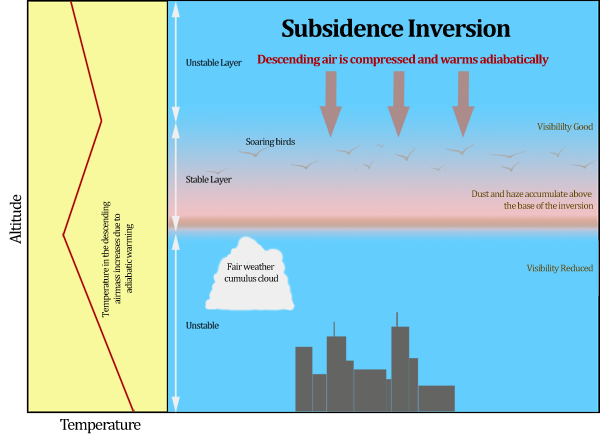
A subsidence inversion is a specific type of temperature inversion caused by air sinking (subsiding) from higher altitudes. While most inversions happen at the ground on cold nights, a subsidence inversion typically occurs aloft, often associated with high-pressure systems (anticyclones).
It is arguably the most powerful “lid” in meteorology, capable of suppressing cloud growth and trapping pollution over entire regions for days at a time.
How it Forms: The Sinking Air Mechanism
The process is driven by adiabatic warming. As air sinks in a high-pressure cell, it moves into regions of higher atmospheric pressure. This compresses the air, causing it to warm up.
- Sinking: Air from the upper troposphere begins to descend.
- Compressional Heating: As it descends, it warms at the Dry Adiabatic Lapse Rate ($10°\text{C/km}$).
- The Temperature Gap: This sinking air eventually becomes significantly warmer than the air directly beneath it.
- The Inversion Layer: A “warm layer” is created several thousand feet above the ground, resting on top of the cooler, moister surface air.
Impact on Cloud Development
A subsidence inversion is the ultimate enemy of vertical cloud growth.
- The “Hard Ceiling”: Even if surface heating creates strong updrafts (unstable air at the ground), those rising parcels will eventually hit the warm subsidence layer. Because the parcel is now colder than the inversion layer, it loses all buoyancy and stops rising.
- Flattened Clouds: If there is enough moisture, clouds will form but will be “squashed” flat against the bottom of the inversion. This often creates a layer of Stratocumulus clouds that spread out horizontally as far as the eye can see.
- Clear Skies Above: Above the inversion layer, the air is incredibly dry and clear because the sinking motion prevents moisture from rising.
Impact on Air Quality and Visibility
Because the inversion acts as a physical barrier, it prevents vertical mixing.
- The “Smog Trap”: Pollutants from cars and factories, as well as smoke from fires, cannot rise past the inversion. They become concentrated in the “marine layer” or surface layer.
- Haze: You will often see a distinct brown or gray line in the sky (the top of the mixing layer), above which the sky is deep blue and clear.
Where Do They Occur?
- Subtropical Highs: The most famous examples occur on the eastern sides of subtropical high-pressure cells, such as off the coast of Southern California or North Africa. This is why Los Angeles is famous for both its sunny weather and its persistent smog.
- Winter Highs: Stagnant high-pressure systems over land in winter can create “stagnation events,” leading to multi-day fog and poor air quality.
What is an unstable atmosphere?
An unstable atmosphere is one that encourages vertical motion. In this state, if a bubble of air (a parcel) is given even a slight nudge upward, it becomes warmer and lighter than the air surrounding it. Like a hot air balloon, it will continue to rise on its own, often accelerating as it climbs.+1
Instability is the “engine” behind almost all dramatic weather, from simple puffy clouds to violent thunderstorms.
The Recipe for Instability: “Warm Below, Cold Above”
Atmospheric instability occurs when the Environmental Lapse Rate (ELR)—the actual temperature of the sky—drops very quickly with height.
To create this “steep” temperature drop, nature usually uses one of two methods:
- Surface Heating: The sun bakes the ground, which in turn heats the lowest layer of air.
- Upper-Level Cooling: A mass of very cold air moves in high above (often brought in by a jet stream or a cold front).
How it Enhances Cloud Development
In an unstable environment, there is no “lid” to stop air from rising. This leads to convection, the primary driver of cloud growth.
- Vertical Growth: Clouds don’t just sit in flat layers; they grow tall. You will see “towering” clouds with defined, cauliflower-like edges.
- The Transition: A small Cumulus humilis (fair-weather cloud) can quickly grow into a Cumulus congestus (towering cumulus) and eventually a Cumulonimbus (thunderstorm).
- Energy Release: As the rising air cools and its water vapor condenses into droplets, it releases latent heat. This heat makes the parcel even warmer than the surrounding air, giving it a secondary “boost” of energy to climb even higher.
Visual and Weather Characteristics
You can identify an unstable day by looking for these specific signs:
- Cloud Types: Puffy, heap-like clouds with significant height (Cumulus family).
- Precipitation: Sudden, heavy bursts of rain or “showers.” Unlike the steady drizzle of a stable day, this rain starts and stops abruptly.
- Visibility: Usually excellent outside of the rain itself. Because the air is mixing vertically, dust and pollution are carried away and dispersed.
- Flight Conditions: Expect turbulence. Pilots will experience “bumps” as the plane flies through the invisible updrafts and downdrafts of the rising air parcels.
Levels of Instability
Meteorologists use specific terms to describe how “ready” the air is to rise:
| State | Description | Weather Potential |
| Absolutely Unstable | Air rises regardless of whether it is dry or moist. | Rare; usually occurs very close to the hot ground. |
| Conditionally Unstable | Air is stable while dry but becomes unstable once a cloud forms. | The most common state for severe thunderstorms and tornadoes. |
| Neutral | The parcel temperature matches the environment exactly. | Clouds neither grow nor dissipate; they just drift. |
What is a conditionally unstable atmosphere?
A conditionally unstable atmosphere is the most common state of the sky and the “wildcard” of weather forecasting. In this state, the atmosphere is stable for a dry parcel of air but becomes unstable if that air is forced to rise high enough to form a cloud.
The “condition” that must be met is saturation (100% humidity).
The “Two-Phase” Logic
To understand this, we compare the Environmental Lapse Rate (ELR)—how fast the actual sky cools—against the two rates at which a rising bubble of air cools:
- Phase 1: The Dry Start (Stable)As long as the air is dry, it cools at the Dry Adiabatic Lapse Rate (DALR) of $10°\text{C/km}$. In a conditionally unstable atmosphere, the environment cools slower than this (e.g., $8°\text{C/km}$). Because the rising dry air cools faster than its surroundings, it becomes colder/heavier and wants to sink. The air resists rising.
- Phase 2: The Saturated Shift (Unstable)If the air is forced upward (by a mountain or a cold front) until it hits its dew point, a cloud forms. Now, condensation releases latent heat, which slows the parcel’s cooling to the Moist Adiabatic Lapse Rate (MALR) of roughly $6°\text{C/km}$.Now the math flips: the environment ($8°\text{C/km}$) is cooling faster than the cloudy parcel ($6°\text{C/km}$). The parcel suddenly finds itself warmer than the air around it and begins to accelerate upward on its own.
The Critical Thresholds
For conditional instability to exist, the environmental cooling rate must fall right in the “sweet spot” between the two adiabatic rates:
6°C/km < ELR < 10°C/km
- LCL (Lifting Condensation Level): The height where the cloud forms and the cooling rate switches from dry to moist.
- LFC (Level of Free Convection): The “point of no return.” This is the altitude where the parcel finally becomes warmer than the environment and starts rising freely without help.
Why It Matters: The “Trigger”
A conditionally unstable atmosphere can look perfectly calm and clear for hours. It is “potentially” explosive, but it needs a trigger to push the air up to that Level of Free Convection. Common triggers include:
- Heating: Intense afternoon sun warming the surface.
- Orographics: Air being forced up the side of a mountain.
- Frontal Wedging: A cold front sliding under warm air and lifting it.
Once that trigger pushes the air past the “condition” of saturation, you get rapid, vertical cloud growth and often severe thunderstorms.
Visual Summary
| Air State | Behavior | Result |
| Dry Parcel | Cooler than environment | Sinks (Stable) |
| Saturated Parcel | Warmer than environment | Rises (Unstable) |
| Visual Clue | Flat bases with towering tops | Puffy Cumulus/Cumulonimbus |
What causes instability?
In simple terms, instability is caused by a steep temperature gradient between the ground and the upper atmosphere. For air to be unstable, the temperature of the sky must drop rapidly as you go higher.
When the “environmental” air cools much faster than a rising bubble (parcel) of air, that parcel remains warmer and less dense than its surroundings, allowing it to float upward like a hot air balloon.
1. Surface Heating (Daytime Instability)
The most common cause of instability is the sun.
- Mechanism: Solar radiation warms the Earth’s surface, which then warms the thin layer of air directly touching it through conduction.
- Result: This creates a “hot pocket” of air at the bottom of the atmosphere. Since the air a few thousand feet up hasn’t warmed as much, the temperature difference between the ground and the sky becomes extreme.
- Visual clue: Puffy cumulus clouds that start forming in the late morning or afternoon.
2. Cold Air Advection (Upper-Level Cooling)
You can also create instability by cooling the top of the atmosphere rather than warming the bottom.
- Mechanism: A weather front or the jet stream moves a mass of very cold, polar air over a region.
- Result: Even if the ground temperature stays the same, the air aloft is now much colder. This increases the lapse rate (the rate at which temperature drops with height), making it easier for surface air to stay warmer than the environment as it rises.
3. Lifting Mechanisms (The “Nudge”)
Sometimes the air is conditionally unstable, meaning it wants to rise but needs a physical push to get started. These “triggers” include:
- Topographic Lift: Air is forced up the side of a mountain.
- Frontal Wedging: A dense cold front slides under warm air, forcing it upward like a ramp.
- Convergence: Winds from different directions meet and have nowhere to go but up.
4. Adding Moisture (Latent Heat)
Moisture is the “fuel” that sustains instability.
- Mechanism: When a rising parcel of air is moist, it eventually reaches its dew point and forms a cloud. This process (condensation) releases latent heat.
- Result: This extra heat keeps the parcel warmer than it would have been if it were dry. This prevents the parcel from cooling down too quickly, allowing it to remain buoyant and “punch” through stable layers of air.
Summary: The Stability “Teeter-Totter”
| Action | Effect on Stability | Why? |
| Warming the Surface | Increases Instability | Creates a bigger temperature gap with the air above. |
| Cooling the Air Aloft | Increases Instability | Makes the environment “colder” relative to rising parcels. |
| Warming the Air Aloft | Increases Stability | Creates a “cap” or inversion that stops rising air. |
| Cooling the Surface | Increases Stability | Denser air stays at the bottom; no reason to rise. |
What is cloud development?
Cloud development is the process by which invisible water vapor in the air transforms into visible liquid water droplets or ice crystals. While it looks like clouds simply “appear,” they are the result of a precise thermodynamic chain reaction.
For a cloud to develop, three specific ingredients must be present at the same time: moisture, cooling, and nuclei.
1. The Ingredients of a Cloud
Before a cloud can take shape, the environment must provide the “raw materials”:
- Water Vapor: This is the fuel. The more humid the air, the easier it is for a cloud to form.
- Cooling Mechanism: Air must cool down to its Dew Point (the temperature at which it can no longer hold its water vapor).
- Cloud Condensation Nuclei (CCN): Water vapor needs a “surface” to cling to. These are microscopic particles like dust, salt from sea spray, smoke, or even bacteria. Without these particles, clouds struggle to form even in 100% humidity.+1
2. The Process: Step-by-Step
Cloud development almost always follows this sequence:
A. Lifting
Air is forced upward. This can happen through convection (heat from the sun), orographic lift (mountains), or frontal wedging (cold air pushing under warm air).
B. Adiabatic Cooling
As the air rises, it encounters lower atmospheric pressure. The air parcel expands, and as it expands, it loses energy and cools down. This is known as adiabatic cooling.
C. Saturation
Once the air cools to its dew point, it reaches 100% relative humidity. At this specific altitude—known as the Lifting Condensation Level (LCL)—the air can no longer hold its water in gas form.
D. Condensation
The water vapor begins to condense onto the condensation nuclei. This transition from gas to liquid releases latent heat, which actually provides a small burst of energy that can help the cloud continue to grow upward.+1
3. Growth and Shaping
The final “look” of the cloud depends on the atmospheric stability we discussed earlier:
- Vertical Development: If the atmosphere is unstable, the cloud continues to billow upward, forming “heaps” or towers (Cumulus).
- Horizontal Development: If the atmosphere is stable, the rising air hits a “ceiling” and spreads out into flat layers (Stratus).
4. The End of the Cycle: Dissipation
Cloud development is reversible. If the air begins to sink (subsidence), it compresses and warms up. As it warms, it can hold more water vapor again, and the visible cloud droplets evaporate back into invisible gas. This is why you often see clouds “disappear” on the edges or dissolve during the evening as the ground cools.
What is the relationship between convection and clouds?
The relationship between convection and clouds is essentially one of “engine” and “exhaust.” Convection is the physical process that moves heat and moisture upward, and clouds are the visible result of that movement.
In meteorology, this is specifically called convective lifting.
1. Convection as the “Engine”
Convection is the vertical transport of heat. When the sun warms the Earth’s surface, the air directly above it becomes warmer and less dense than the surrounding air.
- The Updraft: This warm “bubble” (parcel) of air begins to rise.
- The Replacement: Cooler, denser air sinks to take its place at the surface, where it is then warmed, creating a continuous convection cell.
2. Cloud Formation: The “Phase Change”
As the warm air parcel rises during convection, it undergoes two critical changes that lead to cloud development:
- Expansion and Cooling: As the parcel reaches higher altitudes where the pressure is lower, it expands and cools (adiabatic cooling).
- Reaching the Dew Point: Eventually, the air cools to the point where it can no longer hold its water vapor. The vapor condenses into liquid droplets around microscopic dust particles.
The visible cloud marks the exact height where the rising air has reached 100% humidity. This height is known as the Lifting Condensation Level (LCL).
3. How Convection Shapes the Cloud
The intensity of the convection determines what the cloud looks like:
A. Shallow Convection (Fair Weather)
If the convection is weak or the atmosphere becomes stable at a low altitude, you get small, puffy Cumulus humilis clouds. These look like floating cotton balls and usually don’t produce rain.
B. Deep Convection (Storms)
If the atmosphere is highly unstable, the convection continues for thousands of feet.
- Latent Heat: As the water vapor turns to liquid, it releases “latent heat.” This provides extra “fuel” to the updraft, making the air even more buoyant.
- Result: The cloud towers into a Cumulonimbus (thunderhead), often reaching the top of the troposphere.
4. The Feedback Loop
Convection and clouds share a “give-and-take” relationship:
- Convection creates clouds: By lifting moisture to cooler altitudes.
- Clouds enhance convection: By releasing latent heat during condensation, which keeps the updraft moving faster.
- Clouds limit convection: Eventually, the cloud cover blocks the sun from reaching the ground, cooling the surface and “turning off” the convective engine.
Summary Table
| Feature | Role in the Relationship |
| Surface Heating | The “Spark” that starts the air moving. |
| Updraft | The “Elevator” carrying moisture upward. |
| Condensation | The “Magic Moment” when the cloud becomes visible. |
| Latent Heat | The “Turbo-boost” that helps the cloud grow tall. |
What is the relationship between topography and clouds?
The relationship between topography (the physical features of the land) and clouds is one of the most reliable “cloud factories” in nature. While convection relies on heat, topography relies on physical force to create clouds.
This interaction is primarily known as the Orographic Effect.
1. The Orographic Lifting Process
When a horizontal wind encounters a mountain or a large hill, the air has nowhere to go but up. This physical redirection of air is called orographic lift.
- Ascent: As the air is forced up the “windward” side of the mountain, it encounters lower pressure and cools adiabatically.
- Saturation: If the air cools to its dew point, water vapor condenses, and clouds form.
- Precipitation: If the lift is strong enough, these clouds produce heavy rain or snow on the windward slopes.
2. The Rain Shadow Effect
Once the air passes over the peak, the relationship changes drastically.
- Descent: The air begins to sink down the “leeward” (sheltered) side of the mountain.
- Compression and Warming: As the air sinks, it is compressed and warms up.
- Evaporation: Warming air can hold more moisture, so the cloud droplets evaporate back into invisible vapor.
- Result: This creates a rain shadow, a dry region on the back side of the mountain range where clouds rarely form.
3. Unique Topographic Cloud Types
Topography doesn’t just make “normal” clouds; it creates unique shapes that tell us exactly how the air is moving:
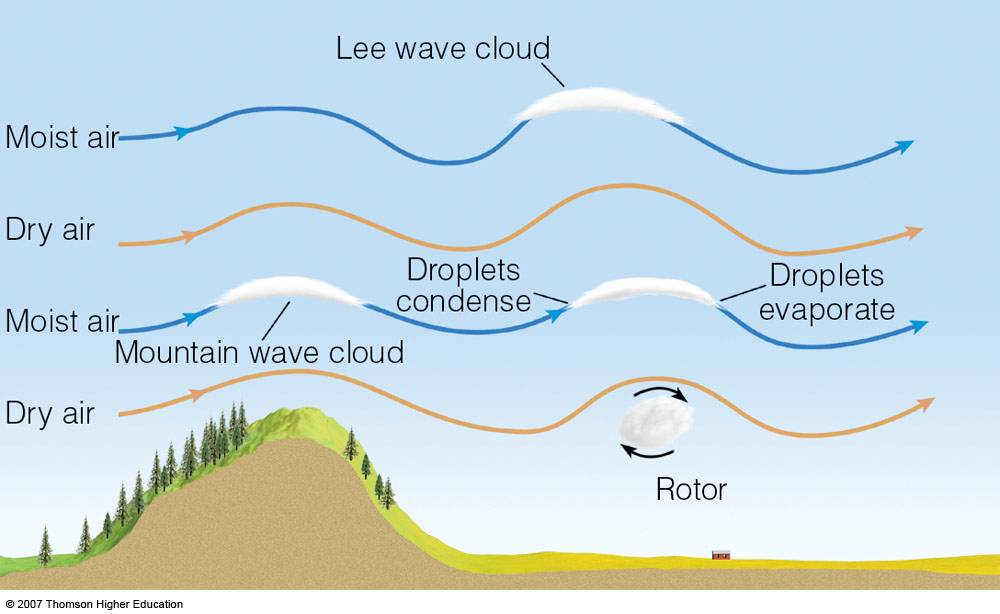
Lenticular Clouds (Altocumulus Lenticularis)
These look like UFOs or stacked pancakes. They form when air travels in waves over a mountain. Even though the wind is moving fast, the cloud appears to stay perfectly still over the peak.
Cap Clouds
A “cap” cloud is a localized cloud that sits directly on top of a mountain peak like a hat. It forms when only the very top layer of air is moist enough to reach saturation as it passes over the summit.
Banner Clouds
These clouds look like a flag or “banner” blowing off a sharp mountain peak. They are created by a pressure drop on the leeward side of the peak that sucks air upward and causes it to condense.
4. Stability and Topography
The landscape interacts differently depending on the stability of the air:
- Stable Air: If the air is stable, it resists going over the mountain. It might get “blocked” and flow around the sides, or it might create a temperature inversion in the valleys, leading to persistent fog.
- Unstable Air: If the air is already unstable, the mountain acts as a “trigger.” The orographic lift provides the initial push, and once the air starts rising, it rockets upward to form massive thunderstorms.
Summary of Impact
| Feature | Windward Side (Front) | Leeward Side (Back) |
| Air Motion | Rising (Ascending) | Sinking (Subsiding) |
| Temperature | Cooling | Warming |
| Cloud Cover | Extensive / Thick | Minimal / Dissipating |
| Climate | Lush / Wet | Arid / Desert-like |
How are convective cloud bases determined?
Determining the base of a convective cloud—the flat bottom of those puffy white cumulus clouds—is essentially a calculation of where rising air will finally “break a sweat” and condense into liquid water.
In meteorology, this height is formally called the Lifting Condensation Level (LCL).
1. The Variables: Temperature vs. Dew Point
To find the cloud base, we look at the relationship between two numbers at the surface:
- Air Temperature (T): How hot the air is.
- Dew Point (Td): The temperature at which the air becomes 100% saturated.
As a “parcel” of air rises via convection, both of these numbers drop, but they drop at different rates. The cloud base is the altitude where they finally meet.
2. The Rates of Change (Lapse Rates)
As air rises:
- Temperature (T) drops fast: It cools at the Dry Adiabatic Lapse Rate, which is roughly 10°C per kilometer.
- Dew Point (Td) drops slowly: Because the amount of moisture in the bubble stays the same (but the pressure drops), the dew point only cools by about 2°C per kilometer.
Because the temperature is “falling” toward the dew point, the gap between them closes by about 8°C for every kilometer of height.
3. The Formula (The “Rule of Thumb”)
For a quick estimate on the ground, meteorologists and pilots often use a simple formula based on the “spread” (the difference between temperature and dew point):
In Metric (Meters):
Heightmeters = (Tsurface – Tdsurface) * 125
In Fahrenheit/Feet:
Heightfeet = (T – Td) / 4.4 * 1000
Example: If it is 30°C outside and the dew point is 14°C, the spread is 16°C.
16 * 125 = 2,000. The cloud bases will be roughly 2,000 meters above the ground.
4. Visual Identification on Charts
On a Skew-T Log-P diagram (the chart produced by a radiosonde), the cloud base is found by:
- Starting at the surface Dew Point.
- Following the line of constant mixing ratio (moisture).
- Finding where it intersects with the Dry Adiabat line coming up from the surface temperature.
The point where those two lines cross is the LCL.
5. Why are bases usually flat?
You may notice that in a field of cumulus clouds, the bottoms all seem to sit on an invisible glass floor. This is because:
- The air mass across a local area usually has a uniform temperature and humidity.
- Therefore, every rising bubble of air has to travel to the exact same altitude before it hits its dew point and becomes visible.
Summary Table
| Factor | Effect on Cloud Base | Why? |
| High Humidity | Lower Bases | The air is already close to its dew point; it doesn’t have to rise far to condense. |
| Low Humidity (Dry) | Higher Bases | The air must rise significantly higher to cool enough to reach its dew point. |
| Increased Heating | Higher Bases | Surface temperature rises, increasing the “spread” and pushing the LCL upward. |
What is a tephigram?
A tephigram is one of four thermodynamic diagrams used by meteorologists to analyze the vertical structure of the atmosphere. While North American forecasters typically use the Skew-T Log-P diagram, the tephigram is the standard in the United Kingdom, Canada, and parts of Europe.
The name comes from its axes: T (Temperature) and φ (Entropy, represented by the Greek letter phi).
1. How to Read the “Grid”
A tephigram looks like a tilted, complex mesh of lines. Its unique design is “equal-area,” meaning the area between two points on the chart is directly proportional to the energy (work) in the atmosphere.
- Temperature (T): Plotted on lines that run diagonally up and to the right.
- Potential Temperature (θ): Plotted on lines that run diagonally up and to the left (representing entropy).
- Pressure: Indicated by nearly horizontal, slightly curved lines.
- Mixing Ratio: Dashed lines representing the amount of water vapor in the air.
2. What is it used for?
Like a medical X-ray for the sky, a tephigram is used to plot data from a radiosonde (weather balloon). By plotting the temperature and dew point lines, forecasters can determine:
Stability and Storm Potential
If the plotted temperature line shows the air is cooling rapidly with height, the atmosphere is unstable. Forecasters look for the area between a rising air parcel and the environmental temperature to calculate CAPE (Convective Available Potential Energy)—essentially the “fuel” for thunderstorms.
Cloud Bases and Tops
Where the temperature and dew point lines meet or come close together, clouds are likely present. The tephigram shows exactly how high a cloud will grow before it hits a stable layer (like a subsidence inversion) and stops.
Frontal Identification
Abrupt changes in temperature and wind direction at specific altitudes allow meteorologists to locate warm or cold fronts passing overhead.
3. Tephigram vs. Skew-T
While they show the same data, they look different:
- Tephigram: Rotated so that lines of constant potential temperature (θ) and temperature (T) are at right angles. This makes it easier to see small changes in stability.
- Skew-T: Rotated so that pressure lines are horizontal. This makes it more intuitive for “height” but can sometimes compress important stability details.
4. Key Features to Look For
- Inversions: If the temperature line tilts to the right as you move up the chart, you’ve found an inversion—a very stable layer that traps pollution and suppresses clouds.
- The “Spread”: The distance between the temperature and dew point lines. A small spread means high humidity and likely clouds; a large spread means dry air.
How do cloud forms change and evolve?
Cloud forms are not static; they are visible signatures of the atmosphere’s constant struggle between temperature, moisture, and motion. A cloud changes shape (evolves) as it moves through different layers of stability or as its internal energy changes.+1
The evolution of a cloud usually follows a path of vertical growth, horizontal spreading, or evaporation.
1. Vertical Evolution (Growth)
This is driven by instability and the release of latent heat. When air is unstable, a cloud evolves upward through stages of “convective bubbling.”
- The Birth (Cumulus Humilis): Small, flat-bottomed “fair weather” clouds. These represent the top of an invisible rising thermal.
- The Growth (Cumulus Congestus): If the air remains unstable, the cloud towers upward, looking like cauliflower. This indicates strong updrafts are winning the fight against gravity.
- The Maturity (Cumulonimbus): Once the cloud hits the Tropopause (the “ceiling” of the lower atmosphere), it can no longer grow up. The top flattens out into an anvil shape (Incus).
2. Horizontal Evolution (Spreading)
This happens when a rising cloud encounters a stable layer or a temperature inversion.
- The “Lid” Effect: When a puffy cumulus cloud hits a stable layer (like a subsidence inversion), it loses its vertical momentum. Instead of growing taller, the moisture begins to spread sideways.
- Transition to Stratiform: A field of individual cumulus clouds can evolve into a solid sheet of Stratocumulus. This is a common evening occurrence as the ground cools and the “engine” of convection shuts off.
3. Microphysical Evolution (Glaciation)
Clouds also change based on the state of matter inside them. This is often visible from the ground as a change in the cloud’s texture.
- Liquid Phase: Lower clouds have sharp, crisp, well-defined edges because they are made of liquid water droplets.
- Glaciation: As a cloud grows into sub-freezing altitudes, the water droplets turn into ice crystals.
- The “Soft” Look: Ice-based clouds (like Cirrus or the top of a thunderhead) look wispy, fuzzy, and blurred. When you see a crisp cumulus cloud start to look “hairy” at the top, you are watching it evolve into an ice cloud.
4. Dissipation (The End of a Cloud)
Clouds “die” or evolve back into invisible vapor through two main processes:
- Entrainment: Dry air from outside the cloud gets pulled in by turbulence. This “eats” the cloud from the outside in, causing the edges to look ragged and eventually vanish.
- Subsidence: If the air begins to sink (downward motion), it warms up. Since warmer air can hold more water vapor, the visible droplets evaporate back into gas.
Summary of Evolutionary Triggers
| Trigger | Resulting Change |
| Increased Instability | Horizontal clouds become vertical (Stratus → Cumulus). |
| Hitting an Inversion | Vertical clouds become horizontal (Cumulus → Stratocumulus). |
| Freezing Altitudes | Crisp edges become wispy/fuzzy (Water → Ice). |
| Sinking Air | Cloud vanishes (Evaporation). |
Solved Problems
Here are 15 scenarios that integrate the principles of stability, topography, and thermodynamic data to forecast atmospheric behavior.
Scenarios Involving Stability and Instability
- High Surface CAPE with a Strong Trigger: * Data: A tephigram shows high Convective Available Potential Energy (CAPE) and a cold front is approaching.
- Forecast: Severe thunderstorms. The front provides the “nudge” to push air to the Level of Free Convection (LFC), where the instability will take over, creating towering cumulonimbus clouds.
- Morning Temperature Inversion: * Data: Ground-level air is 5°C while air at 1,000 feet is 12°C.
- Forecast: Stable conditions. Pollutants and moisture will be trapped at the surface, leading to morning fog or haze and poor air quality.
- Cold Air Advection Aloft: * Data: A jet stream moves a -30°C air mass over a 20°C land surface.
- Forecast: Increasing instability. The lapse rate steepens (warm below, cold above), likely triggering convective cumulus clouds or “cold-core” showers.
- Absolute Stability (ELR < 6°C/km): * Data: The environment cools very slowly with height.
- Forecast: Suppressed cloud development. Any rising air will immediately become denser than its surroundings. Expect clear skies or thin, flat stratus layers if moisture is high.
- Evening Surface Cooling: * Data: The sun sets and the ground rapidly loses heat.
- Forecast: Stabilization. The “convective engine” shuts off. Towering clouds will lose their updrafts and likely evolve into flat stratocumulus or dissipate entirely.
Scenarios Involving Topography
- Strong Windward Flow: * Data: Moist air hits a steep mountain range at 30 knots.
- Forecast: Orographic cloud development. Rapid cooling of the rising air will produce persistent clouds and heavy precipitation on the mountain’s windward side.
- Leeward Descent (Rain Shadow): * Data: Air passes the peak and begins to sink 2,000 meters.
- Forecast: Dissipating clouds. The air warms adiabatically as it sinks, increasing its capacity to hold vapor. This results in clear, arid conditions on the back side of the range.
- Stable Air Encountering a Small Hill: * Data: The atmosphere is absolutely stable as wind hits a 500-meter ridge.
- Forecast: Blocked flow. Because the air is stable, it resists rising. It will likely flow around the hill or become trapped in the valley, potentially creating a “stagnation zone.”
- Lenticular Wave Formation: * Data: High-velocity winds blow over a peak in a stable environment.
- Forecast: Altocumulus lenticularis. The mountain creates a standing wave in the atmosphere. Clouds will form at the “crests” of the wave and disappear at the “troughs.”
- Mountain-Triggered Convection: * Data: A conditionally unstable air mass reaches a mountain range.* Forecast: Localized storms. The mountain provides the mechanical lift needed to reach the LFC. Once the “condition” of saturation is met, storms will develop specifically over the peaks.
Scenarios Involving Tephigrams and Soundings
- Subsidence Inversion Aloft: * Data: The tephigram shows air warming significantly at 700mb (approx. 10,000 ft).* Forecast: The “Lid” effect. Convective clouds will grow until they hit this warm layer, where they will flatten out horizontally into a stratocumulus deck.
- Narrow Temperature-Dew Point Spread: * Data: The T and Td lines on the tephigram are almost touching from the surface to 850mb.* Forecast: Low cloud bases. The Lifting Condensation Level (LCL) is very low; expect low-hanging clouds or thick fog.
- Large CAPE with a High CIN (Capping Inversion): * Data: There is massive energy aloft, but a thin stable layer (Convective Inhibition) is at 5,000 feet.* Forecast: “Loaded Gun” scenario. No clouds will form initially, but if surface heating becomes intense enough to “break the cap,” an explosive, violent thunderstorm will develop rapidly.
- Glaciated Cloud Tops: * Data: The tephigram shows the cloud top reaching the -40°C level.* Forecast: Ice crystal transition. The cloud edges will lose their “cauliflower” look and become wispy/fibrous (Cirrus-like) as liquid water freezes.
- Dry Air Entrainment: * Data: The sounding shows a very dry layer (large T-Td spread) in the middle of an otherwise moist environment.* Forecast: Cloud erosion. As clouds grow into this dry layer, “entrainment” will occur, causing the clouds to look ragged and struggle to maintain their structure.