
Earth and Atmospheric Sciences
At its simplest level, temperature is a measure of how hot or cold something is. But if we peel back the curtain and look at the physics, it’s actually a measurement of kinetic energy—the energy of motion.+1
Think of it this way: everything around you is made of tiny atoms and molecules. These particles are never perfectly still; they are constantly jiggling, vibrating, or zooming around.+1
The Science of “The Jiggle”
When you add heat to an object, you’re essentially giving its atoms a caffeine boost. They move faster and collide more frequently.
- High Temperature: Particles are moving rapidly and chaotically.
- Low Temperature: Particles are moving slowly.
- Absolute Zero: This is the theoretical point where all molecular motion stops entirely.
How We Measure It
Since we can’t exactly watch individual atoms with a stopwatch, we use scales to represent this energy:
| Scale | Reference Point | Best Used For… |
| Celsius | 0°C is freezing; 100°C is boiling (water). | Most of the world & general science. |
| Fahrenheit | 32°F is freezing; 212°F is boiling. | Daily life in the US. |
| Kelvin | 0 K is “Absolute Zero.” | Physical sciences and deep space study. |
Temperature vs. Heat
It’s a common mix-up, but they aren’t the same thing!
- Temperature is the average speed of the particles.
- Heat is the total amount of energy transferred.
The Bathtub Analogy: A cup of boiling water has a much higher temperature than a lukewarm bathtub, but the bathtub has more heat energy because it contains millions more molecules moving around.
What is temperature and how is it measured?
At its core, temperature is a measurement of the average kinetic energy of the particles in a substance. In simpler terms, it’s a gauge of how fast atoms and molecules are “jiggling.”
1. The Physics: Energy in Motion
Everything around you—from the air you breathe to the chair you’re sitting on—is made of atoms. These atoms are constantly moving.
- Hot objects: The particles are zooming or vibrating violently.
- Cold objects: The particles are sluggish and move slowly.
It is important to distinguish Temperature from Heat. Temperature tells you the average speed of the particles, while Heat refers to the total energy being transferred from one object to another.
2. How is it Measured?
Since we can’t see atoms moving, we measure temperature by observing how materials react to changes in energy. This is called thermometry.
Common Methods
- Thermal Expansion: Most liquids (like mercury or dyed alcohol) expand when they get hot and contract when they get cold. In a traditional glass thermometer, the liquid has nowhere to go but up the narrow tube as it expands.
- Electrical Resistance: Digital thermometers often use “thermistors.” As the temperature changes, the material’s resistance to electricity changes. A microchip measures this change and converts it into a digital readout.+1
- Infrared Radiation: Everything that has a temperature emits some light (usually invisible infrared). Infrared thermometers (the ones pointed at your forehead) measure the intensity of this radiation to calculate your temperature without touching you.
3. The Three Major Scales
To make sense of these measurements, we use standardized scales:
| Scale | Freezing Point (Water) | Boiling Point (Water) | Context |
| Celsius (C) | 0°C | 100°C | Used globally for weather and science. |
| Fahrenheit (F) | 32°F | 212°F | Used primarily in the United States. |
| Kelvin (K) | 273.15 K | 373.15 K | The scientific standard; 0 K is “Absolute Zero.” |
A Note on “Absolute Zero”
There is a theoretical limit to how cold something can get. At -273.15°C (or 0 K), molecular motion effectively stops. You can’t get colder than “perfectly still,” which is why the Kelvin scale is so important for physicists.
What are the physical controls of temperature?
When we talk about the “physical controls” of temperature, we are usually looking at the geographic factors that explain why one place on Earth is a frozen tundra while another is a tropical paradise.
Temperature isn’t distributed randomly; it is governed by several predictable physical drivers.
1. Latitude (The Primary Control)
Latitude is the most significant control of temperature. Because the Earth is a sphere, the sun’s rays hit the Equator directly (concentrated energy) but hit the poles at a steep angle (spread-out energy).+1
- Low Latitudes: High concentration of solar radiation year-round.
- High Latitudes: Energy is filtered through more atmosphere and spread over a larger area, leading to lower temperatures.
2. Land and Water Distribution
Land and water heat up and cool down at very different rates. Water has a high specific heat, meaning it takes a lot of energy to change its temperature.
- Marine Climates: Coastal areas have mild summers and winters because the ocean acts as a giant heat stabilizer.
- Continental Climates: Land heats up fast and loses heat fast. Places far from the ocean (like central Canada or Siberia) experience extreme temperature swings between seasons.
3. Altitude (Elevation)
In the lowest layer of the atmosphere (the troposphere), temperature decreases as you go higher. This is known as the Environmental Lapse Rate. On average, for every 1,000 meters you climb, the temperature drops by about $6.5^\circ\text{C}$. This is why you can find snow on top of mountains in the middle of a desert.+1
4. Ocean Currents
The ocean acts like a conveyor belt, moving warm water toward the poles and cold water toward the equator.
- Example: The Gulf Stream carries warm water from the Gulf of Mexico across the Atlantic to Western Europe. This is why London is much warmer than regions in Canada that share the same latitude.
5. Geographic Barriers (Mountains)
Mountain ranges can block the movement of air masses.
- The Rain Shadow Effect: One side of a mountain might be lush and temperate, while the other side is a dry, hot desert because the mountain prevented cool, moist air from passing through.
6. Albedo (Surface Reflectivity)
Albedo refers to how much sunlight a surface reflects versus absorbs.
- High Albedo: Snow and ice reflect most sunlight back into space, keeping the area cold.
- Low Albedo: Dark surfaces like asphalt or dense forests absorb heat, raising the local temperature.
What are seasons?
To many, seasons seem like they should be caused by the Earth getting closer to or further from the sun. However, that’s actually a common misconception! In fact, when the Northern Hemisphere is having summer, the Earth is actually near its farthest point from the sun.
Seasons are actually caused by two specific physical factors: Earth’s axial tilt and its orbit.
1. The Axial Tilt (23.5°)
The Earth doesn’t sit “straight up” relative to its path around the sun; it is tilted at an angle of approximately 23.5 degrees. As Earth orbits the sun, this tilt remains fixed in space, pointing toward the North Star.+1
2. The Result: Changing Sun Angles
Because of this tilt, different parts of the Earth receive the sun’s most direct rays at different times of the year.
- Summer: When a hemisphere is tilted toward the sun, it receives more direct sunlight (higher intensity) and experiences longer daylight hours.
- Winter: When a hemisphere is tilted away from the sun, the sunlight hits at a shallower angle, spreading the energy over a larger area (lower intensity) and resulting in shorter days.
- Spring & Autumn: These occur when neither pole is tilted toward the sun, resulting in roughly equal day and night lengths.
3. Key Seasonal Markers
We mark the transitions between seasons using four specific points in our orbit:
| Event | Approximate Date | What Happens? |
| Summer Solstice | June 21 | The North Pole is at its maximum tilt toward the sun; longest day in the Northern Hemisphere. |
| Winter Solstice | Dec 21 | The North Pole is at its maximum tilt away from the sun; shortest day in the Northern Hemisphere. |
| Vernal Equinox | March 20 | The sun is directly over the equator; nearly equal day and night everywhere. |
| Autumnal Equinox | Sept 22 | The sun crosses the equator moving south; start of fall in the Northern Hemisphere. |
Why are the seasons reversed?
Because the tilt is fixed, when the Northern Hemisphere is leaning toward the sun (Summer), the Southern Hemisphere is naturally leaning away (Winter). This is why Australians celebrate Christmas in the heat of their summer, while North Americans are scraping ice off their windshields.
What are the northern hemisphere seasons?
In the Northern Hemisphere, seasons are defined by the orientation of the Earth’s 23.5° tilt relative to the sun. Because the North Pole points toward the sun for half the year and away for the other half, the intensity and duration of sunlight change predictably.+1
Here is a breakdown of the four seasons in the Northern Hemisphere:
1. Winter (December – March)
- The Shift: Begins at the Winter Solstice (around Dec 21). This is the day the North Pole is tilted furthest away from the sun.
- Conditions: The sun stays low in the sky, and rays hit the ground at a shallow angle, spreading the heat thin. This results in the shortest days and coldest temperatures of the year.
- Key Feature: Areas above the Arctic Circle experience 24 hours of darkness (the “Polar Night”).
2. Spring (March – June)
- The Shift: Begins at the Vernal Equinox (around March 20). Neither pole is tilted toward or away from the sun.
- Conditions: The sun crosses the celestial equator, moving north. Day and night are approximately equal in length. Temperatures begin to rise as the “angle of incidence” (the angle at which sunlight hits Earth) becomes more direct.
- Key Feature: Biological “awakening,” as increasing daylight triggers plant growth and animal migration.
3. Summer (June – September)
- The Shift: Begins at the Summer Solstice (around June 21). The North Pole is at its maximum tilt toward the sun.
- Conditions: The sun reaches its highest point in the sky. Sunlight is highly concentrated, and days are at their longest. This intense solar radiation heats the land and oceans significantly.
- Key Feature: The “Midnight Sun” occurs in the Arctic, where the sun never sets.
4. Autumn/Fall (September – December)
- The Shift: Begins at the Autumnal Equinox (around Sept 22). Similar to Spring, the sun is directly over the equator.
- Conditions: Days begin to shorten again as the Northern Hemisphere starts to tilt away from the sun. The “Lag of the Seasons” means it often stays warm for a few weeks even as daylight decreases, because the oceans hold onto summer heat.
- Key Feature: Deciduous trees lose leaves as a survival strategy for the coming cold.
Comparison of the Seasons
| Season | Start Event | Sun’s Path | Day Length |
| Winter | Winter Solstice | Lowest in sky | Shortest |
| Spring | Vernal Equinox | Getting higher | Increasing |
| Summer | Summer Solstice | Highest in sky | Longest |
| Autumn | Autumnal Equinox | Getting lower | Decreasing |
What are the southern hemisphere seasons?
In the Southern Hemisphere, the seasons are the mirror image of those in the Northern Hemisphere. This happens because the Earth’s 23.5° axial tilt is fixed; when the North Pole leans toward the sun, the South Pole is naturally leaning away, and vice versa.+1
While the causes are the same—the angle of sunlight and day length—the calendar is flipped.
1. Summer (December – March)
- The Shift: Begins at the Summer Solstice (around Dec 21). This is when the Southern Hemisphere is at its maximum tilt toward the sun.
- Conditions: The sun is high in the sky, and rays are most direct (concentrated). This leads to the longest days and warmest temperatures of the year.
- Key Feature: While people in the North are celebrating winter holidays in the cold, people in the South (like in Australia or Brazil) are often at the beach.
2. Autumn/Fall (March – June)
- The Shift: Begins at the Autumnal Equinox (around March 20). The sun is directly over the Equator, moving northward.
- Conditions: Sunlight becomes less direct, and days begin to shorten. Temperatures start to drop as the hemisphere begins its gradual tilt away from the sun.
3. Winter (June – September)
- The Shift: Begins at the Winter Solstice (around June 21). The Southern Hemisphere is tilted at its furthest point away from the sun.
- Conditions: The sun stays low in the sky, even at noon. Sunlight is spread over a larger area (diluted), leading to the shortest days and coldest temperatures.
- Key Feature: The “Polar Night” occurs within the Antarctic Circle, where the sun does not rise at all for a period of time.
4. Spring (September – December)
- The Shift: Begins at the Vernal Equinox (around Sept 22). The sun crosses the Equator again, moving back toward the South.
- Conditions: Days grow longer and the sun climbs higher in the sky. The increase in solar energy triggers the blooming of plants and the end of the cold season.
Seasonal Comparison (Southern vs. Northern)
| Month | Southern Hemisphere | Northern Hemisphere | Sun Angle (South) |
| Dec – Feb | Summer | Winter | Steep / Direct |
| Mar – May | Autumn | Spring | Decreasing |
| Jun – Aug | Winter | Summer | Shallow / Indirect |
| Sep – Nov | Spring | Autumn | Increasing |
Why doesn’t the distance to the sun matter?
Actually, Earth is at its Perihelion (closest point to the sun) in early January. This means the Southern Hemisphere summer technically receives about 7% more intense solar radiation than the Northern Hemisphere summer. However, because the Southern Hemisphere has much more ocean than land, the water absorbs that extra heat, preventing it from getting significantly hotter than the North.
What is the relationship between solar heating and the noon sun?
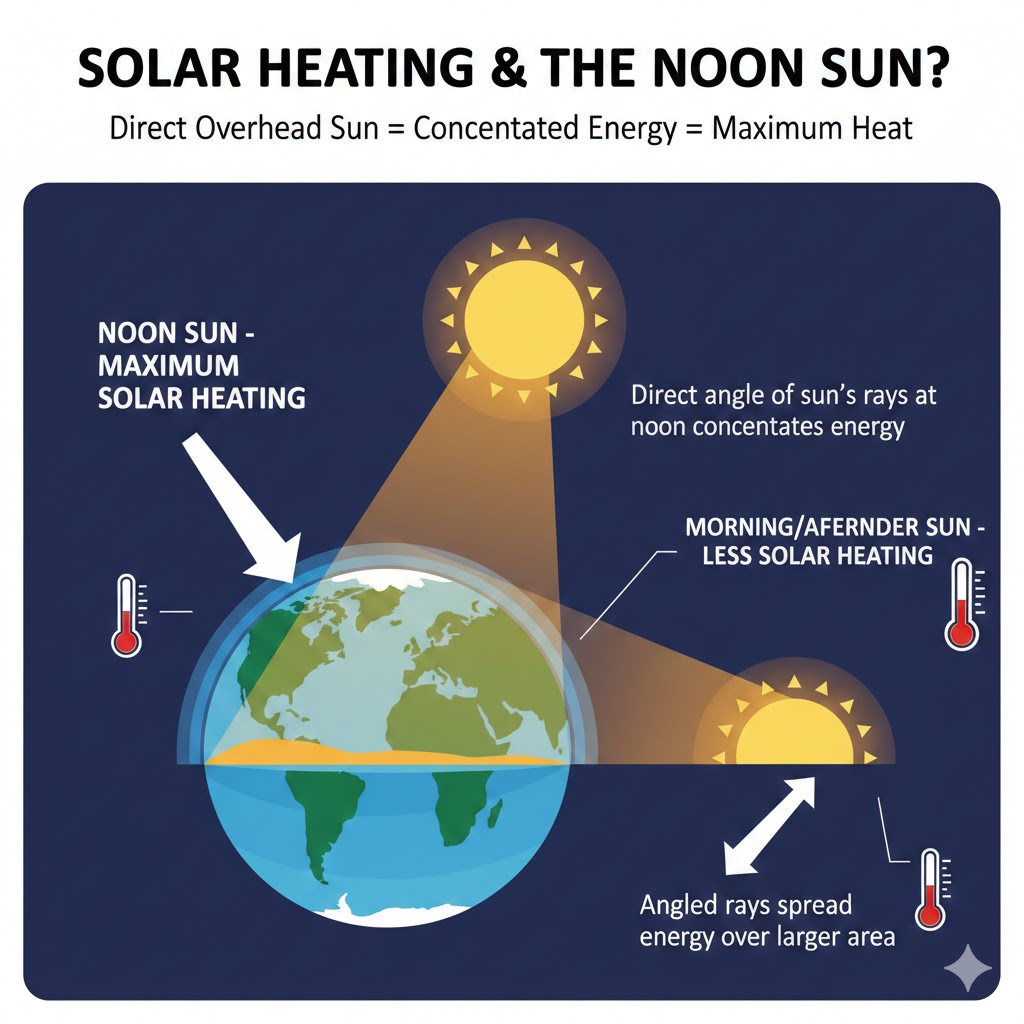
The relationship between solar heating and the noon sun boils down to two factors: intensity and duration. The noon sun represents the point in the day when the sun is at its highest altitude in the sky, which directly dictates how much energy reaches the ground.
1. The Angle of Incidence (Intensity)
The “Noon Sun Angle” is the most important factor in solar heating. When the sun is directly overhead (90°), its rays are concentrated into a small, intense area. As the sun drops lower toward the horizon, the same amount of energy is spread over a much larger surface area.
- Vertical Rays (High Noon): Energy is concentrated. Think of a flashlight pointed straight down at a floor—the circle of light is small and very bright.
- Oblique Rays (Morning/Evening or Winter Noon): Energy is dispersed. Tilt that flashlight, and the light spreads out into a dim, elongated oval.
2. Atmospheric Path Length
At noon, the sun’s rays travel through the shortest possible path of the Earth’s atmosphere to reach the surface.
- When the sun is low on the horizon, the light must travel through a much thicker “slice” of the atmosphere.
- This thicker atmosphere scatters and absorbs more of the energy (specifically UV and blue light), which is why you can look closer to a sunset than a noon sun without as much discomfort. At noon, less energy is lost to the atmosphere, leading to maximum heating.
3. Solar Noon vs. Maximum Temperature
Surprisingly, while the noon sun provides the maximum intensity of solar heating, it is rarely the hottest time of the day. This is due to a concept called Thermal Lag.
- Solar Noon: Incoming solar radiation is at its peak.
- The Lag: The Earth’s surface continues to absorb more energy than it radiates back into space for several hours after noon.
- Daily Peak: Because of this “energy surplus,” the hottest part of the day usually occurs between 2:00 PM and 5:00 PM.
Analogy: Think of a pot of water on a stove. Even if you turn the burner to “High” (Noon), the water doesn’t reach its highest temperature the instant you turn the dial; it takes time for the heat to build up.
4. The Noon Sun and Latitude
The height of the noon sun changes based on your latitude and the time of year.
- At the Equator: The noon sun is frequently near 90°, leading to intense year-round heating.
- At the Poles: Even at noon, the sun is always at a relatively low angle, meaning the heating is always “diluted” and spread out.
What are daily temperature variations?
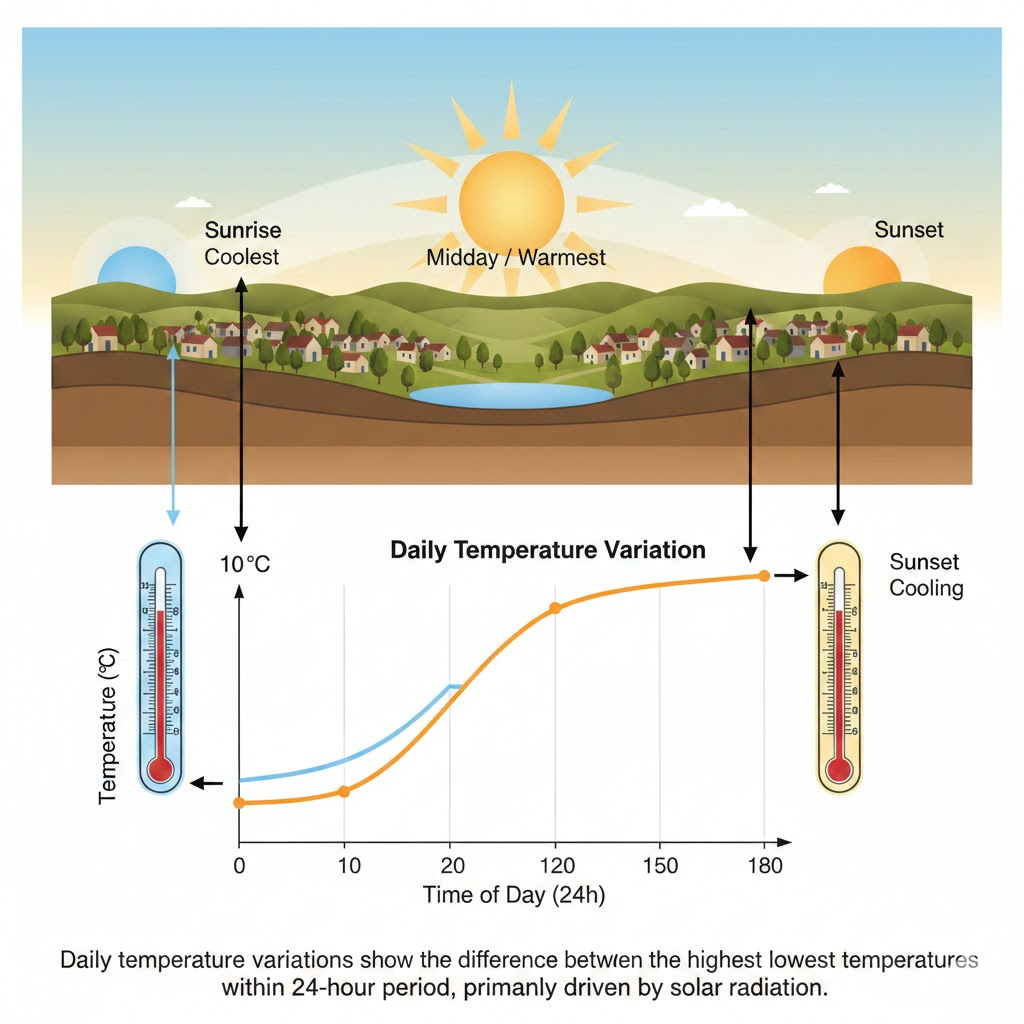
Daily temperature variations refer to the rhythmic rise and fall of air temperature during a 24-hour period. This cycle is driven primarily by the balance between incoming solar radiation (shortwave) and outgoing terrestrial radiation (longwave).+1
1. The Daily Cycle: Why Noon Isn’t the Hottest
If temperature was only about the sun’s position, the hottest time of day would be exactly at solar noon. However, there is a “thermal lag” because the atmosphere is heated primarily from the ground up, not directly by the sun.
- Morning: As the sun rises, incoming solar radiation begins to exceed the energy the Earth is radiating back into space. Temperatures start to climb.
- Solar Noon: The sun is at its highest point, providing the maximum intensity of energy.
- Mid-to-Late Afternoon (2:00 PM – 5:00 PM): This is typically the daily maximum. Even though the sun is getting lower, the Earth is still receiving more energy than it is losing. The peak occurs when incoming energy finally equals outgoing energy.
- Sunset to Sunrise: Once the sun sets, there is no incoming solar radiation, but the Earth continues to emit longwave radiation into space. The temperature drops steadily throughout the night.
- Sunrise: This is typically the daily minimum. The ground has been losing heat all night, and it doesn’t start warming up again until the sun’s first rays hit the surface.
2. Factors That Influence the Daily Range
The difference between the day’s high and low (the diurnal temperature range) isn’t the same everywhere. Several factors can “clamp” or “stretch” this variation:
- Cloud Cover: * Daytime: Clouds reflect sunlight back to space, keeping the day cooler.
- Nighttime: Clouds act like a blanket, trapping outgoing heat and keeping the night warmer.
- Result: Cloudy days have a very small temperature range.
- Humidity: Water vapor is a greenhouse gas. In humid tropical regions, the air holds onto heat at night, leading to a small range. In dry deserts, the lack of moisture allows heat to escape rapidly at night, leading to massive temperature swings (e.g., 40∘C days followed by 0∘C nights).
- Surface Type: Darker surfaces (like asphalt) absorb more heat than lighter surfaces (like snow or grass). Urban areas often stay much warmer at night than rural surroundings—a phenomenon known as the Urban Heat Island effect.
3. Vertical Variations
Temperature doesn’t just change over time; it changes with height.
- Daytime: The air closest to the ground is significantly warmer than the air just a few meters up because the ground is the primary heat source.
- Nighttime (Temperature Inversion): On clear, calm nights, the ground cools so rapidly that the air right above it becomes colder than the air higher up. This “flip” is called a radiation inversion.
What is daytime warming?

Daytime warming is the process by which the Earth’s surface and the lower atmosphere increase in temperature during daylight hours. While we often think of the sun “heating the air,” the process is actually a bit more indirect: the sun heats the ground, and the ground, in turn, heats the air.
1. The Process of Energy Transfer
The atmosphere is largely transparent to incoming shortwave solar radiation. This means the sun’s energy passes through the air without warming it much directly.
- Absorption: The Earth’s surface absorbs this shortwave radiation and heats up.
- Conduction: As the surface gets hot, it transfers heat to the very thin layer of air directly touching it through molecular contact (conduction).
- Convection: Since air is a poor conductor, this heat wouldn’t go very far on its own. However, as that bottom layer of air warms, it becomes less dense and begins to rise in “bubbles” called thermals. This process of convection carries the heat upward, mixing it into the rest of the lower atmosphere.
2. Factors Affecting the Rate of Warming
Not every day (or every location) warms at the same speed. Several physical variables control the intensity of daytime warming:
- Sun Angle: As discussed with the “noon sun,” a higher sun angle concentrates energy into a smaller area, leading to faster warming.
- Surface Albedo: A dark asphalt parking lot has a low albedo; it absorbs almost all solar energy and gets very hot. A snow-covered field has a high albedo; it reflects the energy away, resulting in very little daytime warming.+1
- Specific Heat of the Surface: Dry soil heats up much faster than wet soil or bodies of water. This is why inland areas experience much more intense daytime warming than coastal areas.
- Cloud Cover: Clouds act as a shield, reflecting incoming solar radiation back into space. On a cloudy day, the “energy budget” at the surface is much lower, leading to suppressed warming.
3. The Vertical Temperature Profile
During a sunny day, the temperature of the air is not uniform. Because the heat source is the ground, the air temperature drops sharply as you move away from the surface.
- On a calm, hot afternoon, the air at your feet might be 5°C to 10°C warmer than the air at your head.
- Wind plays a major role here; it acts as a mechanical mixer, swirling the hot air near the ground with the cooler air above, which creates a more uniform temperature but may lower the peak “surface” temperature you feel.
4. When Does Warming Peak?
Warming continues as long as incoming solar radiation exceeds outgoing terrestrial radiation.
- Even though the sun starts to “weaken” after 12:00 PM, the Earth is still receiving more energy than it is losing for several more hours.
- This results in the maximum daytime temperature occurring in the mid-to-late afternoon, usually between 3:00 PM and 5:00 PM.
What is nighttime cooling?

Nighttime cooling is the process by which the Earth’s surface and the atmosphere lose heat after the sun sets. Unlike daytime warming, which is driven by incoming solar energy, nighttime cooling is driven by terrestrial radiation—the Earth emitting energy back into space.
1. The Energy Deficit
The Earth is constantly emitting infrared (longwave) radiation. During the day, the sun’s incoming energy is stronger than this outgoing radiation, so the planet warms up.
At night, the “input” from the sun drops to zero, but the Earth continues to “leak” heat into the cold vacuum of space. This creates an energy deficit, causing the surface temperature to fall steadily until shortly after sunrise.
2. How the Air Cools
Air is a poor conductor of heat. Because of this, the atmosphere doesn’t cool down all at once.
- Surface Radiation: The ground loses heat first and fastest.
- Conduction: The thin layer of air directly touching the ground transfers its heat to the cold surface through conduction.
- Radiation Inversion: On clear, calm nights, the air near the ground becomes much colder than the air above it. This is called a temperature inversion because the normal rule (colder as you go higher) is temporarily flipped.
3. Ideal Conditions for Maximum Cooling
Have you ever noticed that some nights feel much colder than others, even if the daytime highs were the same? Several physical factors control how much the temperature drops:
- Cloud Cover: Clouds act like a thermal blanket. They absorb outgoing terrestrial radiation and re-radiate it back toward the surface. Clear nights are much colder than cloudy nights because the heat escapes directly into space.
- Humidity: Water vapor is a potent greenhouse gas. In dry deserts, the “atmospheric window” is wide open, and heat escapes rapidly. In humid areas, the moisture traps the heat, leading to muggy, warm nights.
- Wind: A light breeze can actually keep the surface warmer. Wind acts as a mixer, swirling the cold air at the surface with the slightly warmer air above. On a perfectly calm night, the cold air settles and “pools” at the surface, leading to lower temperatures and frost.
4. Cooling by Topography
Cold air is denser than warm air. Because of this, at night, cold air acts like a fluid—it “drains” down hillsides and settles into valleys and depressions. This is why a valley floor can be significantly colder (and more prone to frost) than the hillsides surrounding it.
Fun Fact: This is why fruit growers often plant orchards on the sides of hills (slopes) rather than in the bottom of the valley, to keep the trees out of the “frost pocket.”
What are the global record high temperatures?
When we talk about global record high temperatures, it is a mix of long-standing historical markers and modern, highly scrutinized readings. The official “king” of the record books is currently Death Valley, USA, though the validity of that specific 1913 reading is a subject of heated debate among climatologists.
The World Meteorological Organization (WMO) is the official body that verifies these extremes.
The World Record: 56.7°C (134°F)
- Location: Furnace Creek (Greenland Ranch), Death Valley, California, USA.
- Date: July 10, 1913.
- The Controversy: Many modern meteorologists argue this reading was “not possible” from a meteorological standpoint at the time. If this record were ever decertified (as the previous 1922 Libya record was), the “undisputed” record would likely fall to a multi-way tie at 54.0°C (129.2°F) shared by Death Valley (2013), Kuwait (2016), and Israel (1942).
Record Highs by Continent
Here are the highest officially recognized air temperatures for each continent:
| Continent | Temperature | Location | Date |
| North America | 56.7°C (134°F) | Death Valley, USA | July 10, 1913 |
| Africa | 55.0°C (131°F) | Kebili, Tunisia | July 7, 1931 |
| Asia | 54.0°C (129.2°F) | Tirat Tsvi, Israel / Ahvaz, Iran | 1942 / 2017 |
| Australia | 50.7°C (123.3°F) | Oodnadatta / Onslow | 1960 / 2022 |
| South America | 48.9°C (120°F) | Rivadavia, Argentina | Dec 11, 1905 |
| Europe | 48.8°C (119.8°F) | Sicily, Italy | Aug 11, 2021 |
| Antarctica | 18.3°C (64.9°F) | Esperanza Base | Feb 6, 2020 |
Other “Extreme” Heat Records
- Highest Ground Temperature: While air temperature is measured in the shade, the ground gets much hotter. The highest unverified ground temperature was 93.9°C (201°F), recorded in Death Valley in 1972—hot enough to cause third-degree burns instantly.
- Hottest 24-Hour Period: Death Valley recorded a 24-hour average temperature of 47.5°C (117.5°F) on July 12, 2012. This means even in the dead of night, it stayed incredibly hot.
- Highest “Feels Like” (Heat Index): Due to extreme humidity, the Persian Gulf has seen heat indices exceeding 70°C (158°F), pushing the limits of human survivability.
Recent Trends
In the last few years, we’ve seen a surge in “reliable” high-end readings. In July 2021, Death Valley hit 54.4°C (130°F), which is widely considered one of the highest reliably measured temperatures in modern history with digital equipment.
What are the global record low temperatures?
Measuring global record lows is a challenge of extreme survival. While we have official “ground-level” records, modern satellite technology has discovered pockets of cold in Antarctica that are almost hard to fathom.
The World Meteorological Organization (WMO) maintains the official rankings based on thermometers located 2 meters above the ground.
The World Record: −89.2°C (−128.6°F)
- Location: Vostok Station, Antarctica.
- Date: July 21, 1983.
- The Context: This Russian research station sits on the East Antarctic Ice Sheet. At this temperature, steel can become brittle enough to shatter, and exposed skin freezes in seconds.
The “Satellite” Record: ≈−94°C (−137°F)
In 2010 and 2013, NASA satellites identified “pockets” of air near the East Antarctic Plateau (specifically between Dome Argus and Dome Fuji) that reached temperatures as low as −94.7∘C.
- Why it’s not “official”: The WMO only accepts records from ground-based weather stations. Satellites measure the surface temperature of the ice, not the air temperature 2 meters above it.
Record Lows by Continent
The “Poles of Cold” aren’t just in Antarctica; the Northern Hemisphere has its own legendary deep freezes.
| Continent | Temperature | Location | Date |
| Antarctica | −89.2∘C (−128.6∘F) | Vostok Station | July 21, 1983 |
| North America | −69.6∘C (−93.3∘F) | Klinck Station, Greenland | Dec 22, 1991 |
| Asia | −67.7∘C (−89.9∘F) | Oymyakon & Verkhoyansk, Russia | 1933 / 1892 |
| Europe | −58.1∘C (−72.6∘F) | Ust-Shchuger, Russia | Dec 31, 1978 |
| South America | −32.8∘C (−27.0∘F) | Sarmiento, Argentina | June 1, 1907 |
| Australia | −23.0∘C (−9.4∘F) | Charlotte Pass, NSW | June 29, 1994 |
| Africa | −23.9∘C (−11.0∘F) | Ifrane, Morocco | Feb 11, 1935 |
Coldest Inhabited Places
While research stations in Antarctica are the coldest overall, people actually live and work in Northern Asia year-round.
- Oymyakon, Russia: Widely considered the coldest permanently inhabited place on Earth. In winter, the average temperature is around −50∘C (−58∘F).
- Yakutsk, Russia: The coldest major city in the world. It’s not uncommon for schools to stay open until it hits −50∘C.
Why Antarctica is Colder than the Arctic?
Many people assume the North and South Poles are equally cold, but Antarctica is significantly more brutal.
- Altitude: Antarctica is the highest continent, and temperature drops with elevation. The East Antarctic Plateau is over 3,000 meters high.+1
- Land vs. Water: The Arctic is an ocean surrounded by land; the water keeps it “warmer.” Antarctica is a landmass surrounded by ocean, which allows it to lose heat much more effectively.
What are the geographic controls of temperature?
In geography, temperature controls are the physical factors that explain why temperatures vary from one place to another. While the sun provides the energy, these controls act as “filters” or “modifiers” that determine how much of that energy is actually felt on the ground.
1. Latitude (The Master Control)
Latitude is the most important factor because it determines the angle of the sun’s rays.
- Low Latitudes (Equator): The sun’s rays are vertical and concentrated, leading to high temperatures year-round.
- High Latitudes (Poles): The rays hit at a shallow angle, spreading the same amount of energy over a larger area and passing through more atmosphere, which absorbs heat.
2. Differential Heating of Land and Water
Land and water react to solar energy very differently.
- Land: Heats up and cools down rapidly. It has a low “specific heat.”
- Water: Heats up and cools down slowly. It has a high “specific heat,” is transparent (allowing heat to penetrate deeper), and is constantly mixing.
- The Result: Coastal areas have mild, stable temperatures (Marine Climates), while inland areas experience extreme seasonal swings (Continental Climates).
3. Altitude (Elevation)
Temperature decreases as you move higher into the troposphere. On average, for every 1,000 meters of elevation, the temperature drops by about 6.5°C. This is why the peaks of the Andes or Kilimanjaro can be covered in snow even if they are near the Equator.
4. Ocean Currents
The ocean acts as a global radiator.
- Warm Currents: Move from the tropics toward the poles (e.g., the Gulf Stream), keeping coastal regions like Western Europe much warmer than they should be based on latitude.
- Cold Currents: Move from the poles toward the Equator (e.g., the California Current), cooling coastal regions and often creating fog.
5. Geographic Barriers (Mountains)
Mountain ranges can act as walls that block the movement of air masses.
- The Rain Shadow Effect: Moist air is forced up one side of a mountain, where it cools and rains. By the time the air reaches the other side (leeward side), it is dry and warms up quickly as it descends, often creating deserts.
6. Albedo (Surface Reflectivity)
Albedo is the percentage of radiation reflected by a surface.
- High Albedo: Surfaces like snow, ice, and light-colored sand reflect most energy, keeping the air cool.
- Low Albedo: Dark surfaces like asphalt, forests, or dark soil absorb energy, leading to higher temperatures.
Summary Table
| Control | Effect on Temperature |
| Latitude | Determines the basic “energy budget.” |
| Land/Water | Determines the range (seasonal extremes). |
| Altitude | Determines the baseline (colder as you go up). |
| Ocean Currents | Distributes heat/cold across long distances. |
| Albedo | Determines how much energy is kept vs. reflected. |
Calgary is actually a perfect example of these controls at work. You experience high continentality (far from the ocean) and significant altitude (~1,000m), which is why your winters can be so fierce!
What is temperature data?
Temperature data refers to the collection of recorded measurements that describe the thermal state of the atmosphere, oceans, or land over a specific period. It is the “raw evidence” used by meteorologists to predict the weather and by climatologists to track long-term changes in the Earth’s system.
Because temperature varies so much by time and location, we categorize this data into specific “indicators” to make it useful.
1. Common Types of Temperature Data
When you look at a weather report or a scientific study, you are usually seeing one of these four data points:
- Daily Maximum and Minimum: The highest and lowest temperatures recorded in a 24-hour period (usually midnight to midnight).
- Daily Mean (Average): Calculated by adding the maximum and minimum and dividing by two ($\frac{\text{Max} + \text{Min}}{2}$).
- Monthly/Annual Mean: The average of all daily means for a specific month or year. This helps smooth out “weird” weather days to see the bigger picture.
- Temperature Range: The difference between the highest and lowest values.
- Diurnal Range: Change over 24 hours.
- Annual Range: Change between the hottest and coldest months of the year.
2. How the Data is Collected
Temperature data is only as good as the tools used to grab it. Scientists use three main sources:
- Surface Stations: Thousands of weather stations globally (often located at airports) use electronic sensors housed in Stevenson Screens—white, louvered boxes that protect sensors from direct sunlight while allowing air to flow through.
- Satellites: These measure the “brightness” of infrared radiation emitted by the Earth’s surface and atmosphere. They provide data for the entire planet, including the middle of the ocean where there are no stations.
- Marine Data: Buoys and ships measure the Sea Surface Temperature (SST), which is critical because the oceans hold the vast majority of the Earth’s heat.
3. Visualizing the Data: Isotherms
To make sense of millions of data points, geographers use Isotherms. These are lines on a map that connect points of equal temperature.
- If the lines are close together, the temperature is changing rapidly over a short distance (a high temperature gradient).
- If they are far apart, the temperature is relatively uniform across that region.
4. Why Data Quality Matters
“Raw” temperature data often needs to be adjusted for accuracy. A common issue is the Urban Heat Island effect: a weather station that was in a quiet field in 1950 might now be surrounded by a hot parking lot in 2026. Scientists must “homogenize” the data to ensure they are measuring true atmospheric changes rather than just local pavement heat.
5. Temperature Data in Calgary
In Calgary, our local data is particularly interesting. Because of our altitude and distance from the ocean, your Annual Temperature Range is massive compared to a coastal city like Vancouver. Your data also frequently shows “spikes” caused by Chinook winds, where the temperature can jump 20°C in just a few hours.
What is daily, monthly, and yearly temperatures?
In meteorology and climatology, we don’t just look at a single thermometer reading; we organize temperature data into time-based averages. This allows us to see patterns, define “normal” weather for a location, and track climate change.+1
Here is how these three categories of data are calculated and used.
1. Daily Temperature Data
This is the most “real-time” data used for your daily forecast.
- Daily Maximum: The highest temperature recorded (usually mid-to-late afternoon).
- Daily Minimum: The lowest temperature recorded (usually just before sunrise).
- Daily Mean (Average): Most commonly calculated by adding the Max and Min and dividing by 2.
- Daily Mean = (Maximum + Minimum) / 2
- Daily Range: The difference between the Max and Min. A large range is common in deserts; a small range is common on cloudy or humid days.
2. Monthly Temperature Data
Monthly data is used to characterize the “flavor” of a specific month. It helps us understand if a January was unusually warm or if a July was record-breaking.
- Monthly Mean: This is the average of all the Daily Means for that month. You add up the daily averages for all 28–31 days and divide by the number of days in the month.
- Monthly Mean Maximum/Minimum: Farmers and energy companies often look at the average of all the “highs” or all the “lows” in a month to predict crop growth or heating bills.
3. Yearly (Annual) Temperature Data
Yearly data is the primary tool for studying climate and long-term trends.
- Annual Mean: The average of the 12 monthly means. This gives a single number that represents the entire year’s temperature profile.
- Annual Temperature Range: This is the difference between the mean temperature of the warmest month and the mean temperature of the coldest month.
- This is a huge indicator of Geography. For example, Calgary has a very high annual range (hot summers, cold winters), while an island in the Caribbean has a very small annual range (warm all year).
Summary of Data Comparison
To put this in perspective for our location in Calgary:
| Data Type | Example Value (Approximate) | What it tells you |
| Daily Mean | -5°C | Should I wear a heavy coat today? |
| Monthly Mean | -7°C (January) | Was this a particularly brutal winter? |
| Annual Mean | +4.4°C | Is Calgary’s climate getting warmer over decades? |
| Annual Range | ≈ 26°C | How extreme are the seasons here? |
Why do we care about these averages?
We use these numbers to establish Climate Normals. A “Normal” is typically the average of a specific data point (like Monthly Mean) over a 30-year period. When the weatherman says it is “above average today,” they are comparing today’s daily data to that 30-year monthly mean.
When it comes to temperature, what’s normal?
In the world of meteorology, “normal” isn’t just a vague feeling—it is a very specific statistical calculation known as Climate Normals.
Because weather varies wildly from year to year, scientists use a 30-year moving average to define what you should typically expect on any given day.
1. The 30-Year Rule
The World Meteorological Organization (WMO) dictates that “normals” must be recalculated every 10 years to account for shifting climate patterns.
- Currently, most weather agencies use the period from 1991 to 2020 as the baseline.
- When a forecaster says, “It’s 5°C above normal,” they are comparing today’s temperature to the average of that specific day over those 30 years.
2. The “Bell Curve” of Normal
If you plotted every temperature recorded on a specific date (like February 11) over 100 years, most of them would cluster around a central value.
- The Mean: This is the “normal” number you see on the news.
- Standard Deviation: This represents the typical “wiggle room.” In some places, being 10°C away from normal is common; in others (like the tropics), a 3°C shift would be an extreme event.
3. What’s “Normal” for Calgary?
In Calgary, our “normal” is actually quite strange compared to the rest of the world. Because of the Chinook winds, Calgary has some of the most volatile temperature data on Earth.
For February 11 in Calgary, the climate normals are roughly:
- Normal High: -1°C (30°F)
- Normal Low: -13°C (9°F)
However, because your “normal” includes years with Chinooks (where it might be +15°C) and years with Arctic vortices (where it might be -35°C), the “average” rarely happens. You spend more time at the extremes than at the actual average!
4. Is “Normal” Changing?
Yes. As the planet warms, the 30-year baselines are shifting upward.
- The 1991–2020 normals are significantly warmer than the 1961–1990 normals.
- This creates a “moving goalpost” problem: what we call a “normal summer” today would have been considered a “heatwave” 50 years ago.
Summary: The Three Faces of Normal
- Arithmetic Normal: The raw 30-year average.
- Seasonal Normal: What is typical for a time of year (e.g., “A normal winter”).
- Biological Normal: The temperatures at which local plants and animals are adapted to thrive.
How is temperature data used?
Temperature data is the “pulse” of the planet. Because temperature influences almost every physical and biological process on Earth, this data is used across dozens of industries to save money, protect lives, and plan for the future.
Here is how different sectors turn raw numbers into actionable decisions:
1. Agriculture (Timing the Harvest)
Farmers don’t just look at today’s temperature; they look at Cumulative Growing Degree Days (GDD).
- Planting: Many seeds won’t germinate until the soil reaches a specific, consistent temperature.
- Pest Control: Scientists use temperature data to predict when certain insects will hatch or when crop diseases (like blight) are likely to spread.
- Frost Protection: Real-time alerts allow fruit growers to turn on massive fans or heaters to keep cold air from settling in low-lying orchards.
2. Energy Management (Balancing the Grid)
Power companies use temperature data to predict “load.”
- Peak Demand: On a day when the forecast in Calgary hits +30°C or -30°C, the demand for electricity (for AC or heating) spikes. Utilities use historical data to ensure they have enough power plants “online” to prevent blackouts.
- Renewables: Solar panel efficiency drops as they get too hot, and wind turbines have specific temperature cut-offs to prevent mechanical failure in extreme cold.
3. Public Health (Early Warning Systems)
City officials use temperature data to trigger emergency responses.
- Heat/Cold Alerts: When temperatures pass a certain “normal” threshold, cities open warming centers or cooling stations.
- Disease Tracking: Many viruses and bacteria (and the mosquitoes that carry them) thrive only in specific temperature ranges. Data helps health organizations predict where outbreaks might happen next.
4. Transportation and Infrastructure
Engineers use temperature extremes to decide how to build our world.
- Roads and Rails: In extreme heat, asphalt can soften and railway tracks can actually buckle (called “sun kinks”). In extreme cold, steel becomes brittle. Data tells engineers what grade of material to use for a specific climate.
- Aviation: Hot air is less dense than cold air. On very hot days, airplanes need more runway to take off because they get less “lift.” Pilots use real-time data to calculate exactly how much weight (fuel or passengers) they must leave behind to take off safely.
5. Supply Chain and Logistics
The “Cold Chain” is a multi-billion dollar industry that relies entirely on temperature data.
- Food & Medicine: Vaccines (like those for COVID-19) and fresh produce must stay within a strict temperature range from the factory to your door. Bluetooth and cellular sensors travel inside the boxes, providing a constant stream of data to ensure the product never “broke the chain.”
6. Climate Science (The Big Picture)
By looking at Temperature Anomalies (how much a year’s temperature differs from the 30-year average), scientists can track global warming. This data is used by policymakers to set carbon emission goals and by insurance companies to price the risk of future natural disasters.
In Calgary, you might see this data in action every winter: city crews use infrared pavement thermometers to decide exactly when to apply salt or brine to the roads—if the ground is too cold, the salt won’t work!
What is the relationship between temperature and human comfort?
The relationship between temperature and human comfort is surprisingly complex because “feeling comfortable” isn’t just about the number on a thermometer. It’s about the heat balance between your body and the environment.
Your body is like a furnace that needs to stay at a constant internal temperature of roughly 37°C (98.6°F). Comfort occurs when your body can maintain this temperature with minimal effort.
1. The Energy Balance Equation
To stay comfortable, your body must balance the heat it produces (metabolism) with the heat it loses to the surroundings. This happens through four physical processes:
- Conduction: Direct contact with surfaces (like cold tiles vs. a warm rug).
- Convection: Heat carried away by moving air (the “wind chill” effect).
- Radiation: Losing heat to cold walls or gaining it from the sun or a fireplace.
- Evaporation: Your primary cooling mechanism (sweating).
2. The “Comfort Triad”
Meteorologists and engineers focus on three main variables that dictate how we perceive temperature:
A. Air Temperature
The baseline. Most humans find the “thermal neutral zone” to be between 20°C and 25°C (68°F–77°F).
B. Humidity (The “Muggy” Factor)
High humidity makes hot temperatures feel much hotter because it prevents sweat from evaporating. If sweat can’t evaporate, your “cooling system” breaks down. This is why we use the Heat Index.
- Low Humidity: Your skin feels cool as sweat evaporates quickly.
- High Humidity: You feel “sticky” and overheated.
C. Air Movement (The “Wind” Factor)
Wind increases heat loss through convection.
- In Winter: Wind strips away the thin layer of warm air trapped against your skin, making it feel much colder (Wind Chill).
- In Summer: A breeze helps evaporate sweat, making a hot day feel bearable.
3. The “Feels Like” Scales
Because of these variables, we use specific indexes to measure human comfort more accurately than a standard thermometer:
| Index | Factors Used | What it Measures |
| Wind Chill | Temp + Wind Speed | How fast your skin loses heat in the cold. |
| Heat Index | Temp + Humidity | How much your body’s cooling is hindered by moisture. |
| Humidex | Temp + Dew Point | A Canadian specific scale for perceived summer heat. |
4. Psychological and Adaptive Factors
Comfort is also subjective and influenced by:
- Acclimatization: In Calgary, you might find 10°C in April to be “t-shirt weather,” but the same temperature in October feels “freezing” because your body hasn’t adapted to the change yet.
- Clothing (The “Clo” Unit): Clothing acts as an insulator, reducing heat loss by trapping air.
- Metabolic Rate: A person sitting at a desk will feel cold in a room where someone else is vacuuming or exercising.
Why Calgary feels different
In Calgary, you benefit from low humidity. A 25°C day in Calgary feels significantly more comfortable than a 25°C day in Toronto because your sweat evaporates instantly, cooling you down effectively. However, your Wind Chill can be much more dangerous because the dry air combined with high winds at your altitude strips heat from your body very quickly.
How is it possible to freeze to death in air that is a thousand degrees?
It sounds like a total paradox, but this is a classic “space physics” problem. To understand how you could freeze in 1,000°C air, we have to look at the difference between temperature and heat.
The short answer: Temperature is about speed, but heat is about mass.
1. The Thermosphere Example
This actually happens in a layer of our atmosphere called the Thermosphere. If you were to hang a thermometer there, it might read 1,500°C (2,700°F). Yet, if you stepped out of a spacecraft there without a heated suit, you would freeze to death almost instantly.
- High Temperature: The few gas molecules present are moving incredibly fast (high kinetic energy). Because they are moving so fast, their “temperature” is technically very high.
- Low Heat: The air is so thin (almost a vacuum) that those hot molecules are kilometers apart. There aren’t enough of them to actually bump into your skin and transfer their energy to you.
2. Temperature vs. Heat Transfer
Temperature tells you how fast the “jiggling” is, but Heat is the total energy transferred.
Imagine two scenarios:
- A single spark from a sparkler (1,000°C): It hits your skin and you barely feel it. The temperature is high, but there is so little mass that the total heat energy is tiny.
- A pot of boiling water (100°C): This will cause a severe burn. Even though the temperature is 10 times lower than the spark, the density of the water means millions more molecules are hitting your skin and transferring energy.
The Vacuum Problem: In the “thin air” of the thermosphere, you lose heat through radiation (your body heat glowing away into space) much faster than the sparse, hot air molecules can give you heat through conduction.
3. The “Sauna vs. Soup” Analogy
Think about a dry sauna set to 90°C (194°F). You can sit in there for 15 minutes comfortably because air is not very dense. Now, imagine jumping into a pot of soup at that same temperature. You would be cooked instantly.
Now, take that sauna and remove 99.9999% of the air molecules but keep them moving at 1,000°C speeds. There is now so little “stuff” touching you that your body’s own internal heat would just radiate away into the empty space, and you would freeze.
Summary Table
| Feature | The 1,000°C Air (Thermosphere) | A 100°C Oven |
| Particle Speed | Extremely Fast (High Temp) | Fast |
| Particle Density | Nearly Zero (Vacuum) | High |
| Energy Transfer | Negligible | Significant |
| Result | You lose heat (Freeze) | You gain heat (Burn) |
What is human thermal comfort?
Human thermal comfort is defined by the American Society of Heating, Refrigerating and Air-Conditioning Engineers (ASHRAE) as “that condition of mind which expresses satisfaction with the thermal environment.”
In simpler terms, it is when you feel “just right”—neither too hot nor too cold. It isn’t just about the temperature on the wall; it’s a complex balance between your body’s internal heat production and the environment’s ability to take that heat away.
The Six Primary Factors
To determine if a space is “comfortable,” scientists and engineers look at six key variables. These are divided into environmental factors (the room) and personal factors (you).
Environmental Factors
- Air Temperature: The actual temperature of the air around you.
- Radiant Temperature: The heat coming off surrounding surfaces (like a cold window or a hot radiator). Even if the air is 22°C, sitting next to a freezing window will make you feel cold.
- Air Velocity (Wind): Moving air increases heat loss through convection. A “stuffy” room has zero air velocity, while a “drafty” room has too much.
- Humidity: High humidity prevents sweat from evaporating, making you feel “sticky” and hot. Low humidity can dry out your skin and throat.
Personal Factors
- Clothing Insulation (clo): The amount of thermal resistance provided by your clothes. A heavy sweater has a high “clo” value, while a t-shirt has a low one.
- Metabolic Rate (met): The amount of heat your body is generating. You produce much more heat while running (high met) than while sleeping (low met).
How We Measure Comfort: The PMV Scale
Because comfort is subjective, we use the Predicted Mean Vote (PMV). This is a 7-point scale used to predict how a large group of people would feel in a specific environment:
| Score | Sensation |
| +3 | Hot |
| +2 | Warm |
| +1 | Slightly Warm |
| 0 | Neutral (Comfortable) |
| -1 | Slightly Cool |
| -2 | Cool |
| -3 | Cold |
Most building standards (like ASHRAE 55) aim for a PMV between -0.5 and +0.5. Even in this “perfect” range, about 10% of people will still be dissatisfied (PPD), because everyone’s body is different!+1
The Heat Balance Equation
At its core, comfort is a math problem. Your body must maintain a core temperature of roughly 37°C.
Heat Produced – Heat Lost = 0
- If the result is Positive: You store heat, your core temperature rises, and you feel Hot.
- If the result is Negative: You lose heat faster than you make it, and you feel Cold.
- If the result is Zero: You are in “thermal equilibrium” and feel Comfortable.
Why Calgary Feels Different
Living in Calgary, our perception of comfort is influenced by low humidity and altitude. Dry air allows your sweat to evaporate very efficiently, which makes hot summer days feel more comfortable than they would in a humid city like Toronto. However, that same dry air makes your skin lose heat faster in the winter, making “calm” cold days feel less biting than “windy” ones.
How is temperature measured?
To measure temperature, we can’t observe the speed of atoms directly with a stopwatch. Instead, we measure how physical properties change when energy is added or removed.
This field of study is called thermometry, and it relies on a few clever “hacks” of physics.
1. Thermal Expansion (Mechanical)
Most substances—liquids, solids, and gases—expand when they get hot and contract when they get cold.
- Liquid-in-Glass: This is the classic thermometer. A bulb of liquid (usually alcohol or mercury) is connected to a very narrow tube. Because the tube is so thin, even a tiny expansion of the liquid forces it to “climb” significantly higher, making it easy for us to read against a scale.+2
- Bimetallic Strips: These use two different metals (like brass and iron) bonded together. Because they expand at different rates, the strip bends as it heats up. This mechanical bending is what moves the needle on an oven or meat thermometer.
2. Electrical Resistance (Digital)
Almost all modern digital thermometers use electricity to “feel” the temperature.
- Thermistors and RTDs: These are resistors that change their ability to conduct electricity as they get hotter.
- In a thermistor, the resistance usually drops as it gets hot.
- In a Resistance Temperature Detector (RTD), the resistance rises.
- A microchip measures this change in current and “translates” it into a digital number on your screen.
- Thermocouples: These use two different metal wires joined at one end. When the junction is heated, it actually generates a tiny voltage. The hotter it gets, the higher the voltage.+1
3. Thermal Radiation (Infrared)
This is “contactless” measurement. Every object with a temperature above absolute zero emits invisible Infrared (IR) radiation.
- How it works: An IR thermometer (like a forehead scanner or “thermal gun”) has a lens that focuses this radiation onto a sensor called a thermopile.
- The sensor converts the incoming “heat light” into an electrical signal. Because the intensity of the light is mathematically tied to temperature, the device can instantly calculate how hot the object is from several inches away.
4. Setting the “Rules” (Scales)
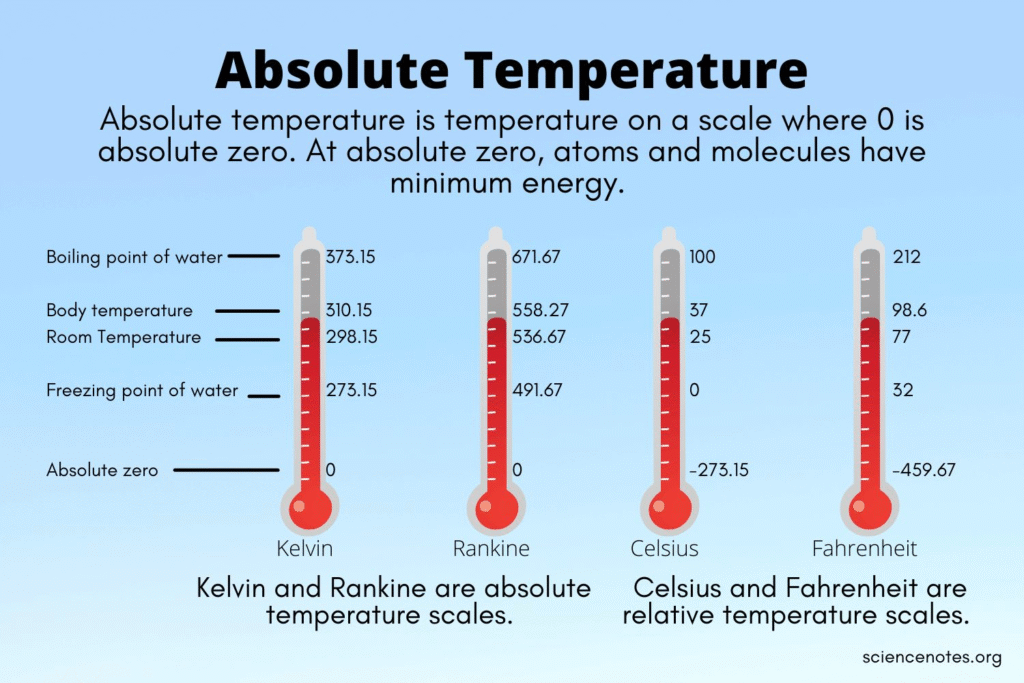
To make these measurements useful, we have to agree on a scale. We generally use three different “rulers” to measure the same thing:
| Scale | Freezing Point | Boiling Point | Purpose |
| Celsius (°C) | 0° | 100° | Most of the world & standard science. |
| Fahrenheit (°F) | 32° | 212° | Daily life in the USA. |
| Kelvin (K) | 273.15 | 373.15 | Physics; 0 K is “Absolute Zero.” |
What is the Vancouver Island School-Based Weather Station Network?
The Vancouver Island School-Based Weather Station Network (often referred to as the UVic Weather Network) is one of the most dense and sophisticated regional weather observation networks in North America.
Based out of the University of Victoria (UVic), this project transformed the rooftops of local schools into a massive scientific laboratory.
1. The Core Objective
The network was designed with a dual purpose:
- Scientific Research: To provide high-resolution meteorological data for a region with incredibly complex terrain. Standard government stations (like those at airports) are often too far apart to capture the “microclimates” created by Vancouver Island’s mountains and coastlines.
- Educational Outreach: To get real-world science into K-12 classrooms. Students can use live data from their own school’s roof to learn about math, physics, and geography.
2. How the Network Functions
The network consists of nearly 100 weather stations spread across Vancouver Island and the surrounding Gulf Islands.
- Hardware: Each station typically uses a high-end commercial weather suite (often Davis Vantage Pro2 units) that measures temperature, humidity, pressure, wind speed/direction, and rainfall.
- Real-Time Data: Each station is connected to the internet and uploads data every minute. This information is then processed and displayed on a public-facing website for anyone to use.
3. Why It’s Unique
Most weather networks are managed by federal agencies (like Environment Canada), but this network offers a much “tighter” grid of data:
- Microclimate Mapping: Because Vancouver Island has dramatic elevation changes, the temperature in a valley can be 5°C different from a school just two kilometers away. This network captures those variations.
- Storm Tracking: The network is vital for tracking “Rain Shadows” and the Juan de Fuca Strait wind patterns, which are notoriously difficult to predict.
- Open Source for Science: The data is used by researchers to study urban heat islands and by local emergency management crews to monitor for flood risks or extreme wind events.
4. Comparison: Calgary vs. Vancouver Island
In Calgary, we’re used to a relatively flat (though high altitude) plateau where a few weather stations can represent large areas. On Vancouver Island, the geography is so “wrinkled” that you need this school-based network to know what’s actually happening in a specific neighborhood.
| Feature | Standard Network (Federal) | UVic School Network |
| Station Spacing | Every 50–100 km | Every 2–5 km (in urban areas) |
| Update Frequency | Hourly | Every 1–5 minutes |
| Primary Goal | General Forecasting | Micro-scale Research & Education |
How to use it
The data is completely public. You can visit their interactive map to see exactly how much rain is falling on a specific elementary school in Victoria versus a high school in Nanaimo.
Solved Problems
1. The Hemispheric Mirror Problem
Problem: Why is it that when people in Canada are shoveling snow in December, people in Australia are often heading to the beach?
Solution: The Earth is tilted at an angle of $23.5^\circ$. In December, the Northern Hemisphere is tilted away from the sun, while the Southern Hemisphere is tilted toward it, creating opposite seasons simultaneously.
2. The Noon Sun Intensity Problem
Problem: Why is the sun’s heat more intense at noon than at 4:00 PM, even if the afternoon air feels hotter?
Solution: At noon, the sun is at its highest point, meaning its rays hit the Earth most directly (vertically). This concentrates the energy into a smaller surface area, whereas afternoon rays are spread out at a shallower angle.
3. The “Hottest Time of Day” Paradox
Problem: If the sun provides the most energy at solar noon, why does the temperature continue to rise for several hours afterward?
Solution: This is due to thermal lag. The Earth’s surface continues to receive more energy than it radiates back into space for several hours after noon. The temperature only peaks when outgoing radiation finally equals incoming solar energy.
4. The Desert Temperature Swing Problem
Problem: Why do dry deserts experience massive temperature drops at night compared to humid tropical rainforests?
Solution: Water vapor is a greenhouse gas that traps heat. In humid areas, moisture acts as a blanket; in dry deserts, the “atmospheric window” is open, allowing terrestrial radiation to escape rapidly into space.
5. The Nighttime Inversion Problem
Problem: On a clear, calm night, why is the air at the bottom of a valley often much colder than the air on the hillsides above it?
Solution: Cold air is denser than warm air. At night, it behaves like a fluid, “draining” down slopes and pooling in low-lying areas. This creates a temperature inversion where the normal rule of “colder as you go higher” is reversed.
6. The “Freeze in 1,000°C Air” Problem
Problem: How can a human freeze to death in the Thermosphere where air temperatures are recorded at over 1,000°C?
Solution: The air in the Thermosphere is so thin (nearly a vacuum) that there aren’t enough molecules to bump into you and transfer heat. You lose your body heat through radiation faster than the few high-speed molecules can give it back.
7. The Aviation Lift Problem
Problem: Why do airplanes need longer runways to take off on extremely hot days?
Solution: Hot air is less dense than cold air. Because the air is “thinner,” the wings generate less lift and the engines produce less thrust, requiring the plane to reach a higher speed on the ground before it can fly.
8. The Record High Validity Problem
Problem: Why is the world-record high of $56.7^\circ\text{C}$ in Death Valley (1913) often questioned by modern scientists?
Solution: Many meteorologists believe the 1913 reading was a result of observer error or equipment placement, as it didn’t align with other regional weather data at the time. Modern verified readings are usually a few degrees lower.
9. The Land vs. Water Heating Problem
Problem: Why does a coastal city like Vancouver have milder winters and cooler summers than an inland city like Calgary?
Solution: Water has a higher specific heat than land, meaning it warms and cools much more slowly. The ocean acts as a massive thermal regulator, whereas land (continentality) allows for extreme temperature swings.
10. The Urban Heat Island Problem
Problem: Why are city centers usually several degrees warmer at night than the surrounding rural countryside?
Solution: Cities are filled with dark surfaces (asphalt/concrete) that have low albedo, meaning they absorb massive amounts of heat during the day and slowly release it at night.
11. The Humidity-Comfort Problem
Problem: Why does a $30^\circ\text{C}$ day in a humid climate feel much more miserable than a $30^\circ\text{C}$ day in a dry climate?
Solution: High humidity prevents sweat from evaporating. Since evaporation is the body’s primary cooling mechanism, “sticky” air causes the body to overheat because it can’t shed its internal energy.
12. The Stevenson Screen Problem
Problem: Why must weather thermometers be kept in white, louvered boxes rather than just hanging on a wall in the sun?
Solution: Direct sunlight would heat the thermometer itself, giving a “radiant” reading rather than the actual air temperature. The white box reflects sunlight, while the louvers allow air to flow through for an accurate “shade” measurement.
13. The “Normal” Weather Problem
Problem: If we are currently experiencing a “Normal” winter, does that mean the temperature is exactly at the 30-year average every day?
Solution: No. “Normal” is a statistical average. Especially in volatile climates like Calgary, the daily temperature might swing wildly above and below the mean, with the “average” itself rarely occurring.
14. The Microclimate Mapping Problem
Problem: Why is a school-based weather network (like UVic’s) more useful for storm tracking than a single airport weather station?
Solution: Geography like mountains and coastlines creates microclimates. A network with stations every 2 km can track how a storm interacts with specific hills or valleys, which a single distant station would miss.
15. The Thermal Radiation Problem
Problem: How does an infrared “no-touch” thermometer measure your temperature without actually touching your skin?
Solution: Everything above absolute zero emits invisible infrared radiation. The thermometer uses a lens to focus this “heat light” onto a sensor that calculates the temperature based on the intensity of the radiation emitted.