
Earth and Atmospheric Sciences
In urban geography and planning, the “Theory” of land use describes how cities should or logically would grow under ideal conditions, while the “Practice” represents the messy, real-world application of these ideas.
The gap between the two is often driven by human behavior, politics, and historical baggage that abstract models cannot fully account for.
1. Theory: The Idealized Models
Theories of urban land use generally assume a “rational” actor (someone looking to maximize profit or minimize commute) and a “featureless plain” (no mountains or rivers to get in the way).1
Classic Theoretical Models
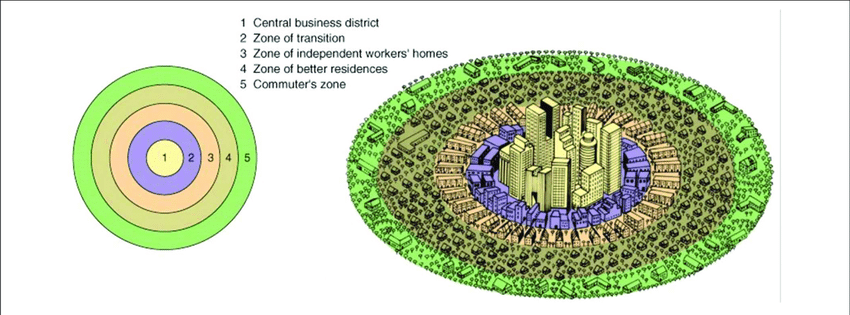
- Concentric Zone Model (Burgess, 1925):2 Views the city as a series of rings. The center is the Central Business District (CBD), surrounded by a “transition zone” of industry, then working-class housing, and finally high-class commuter zones at the edge.
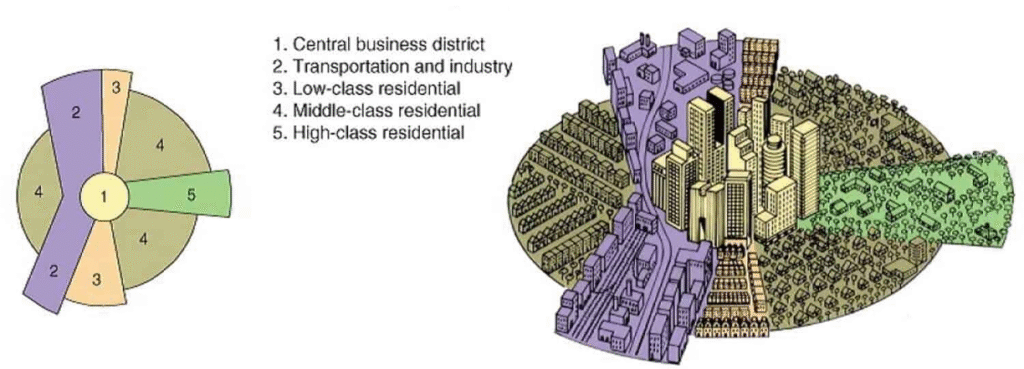
- Sector Model (Hoyt, 1939):3 Suggests that cities grow in “wedges” or sectors radiating out from the center, often following transportation corridors like rail lines or highways.4
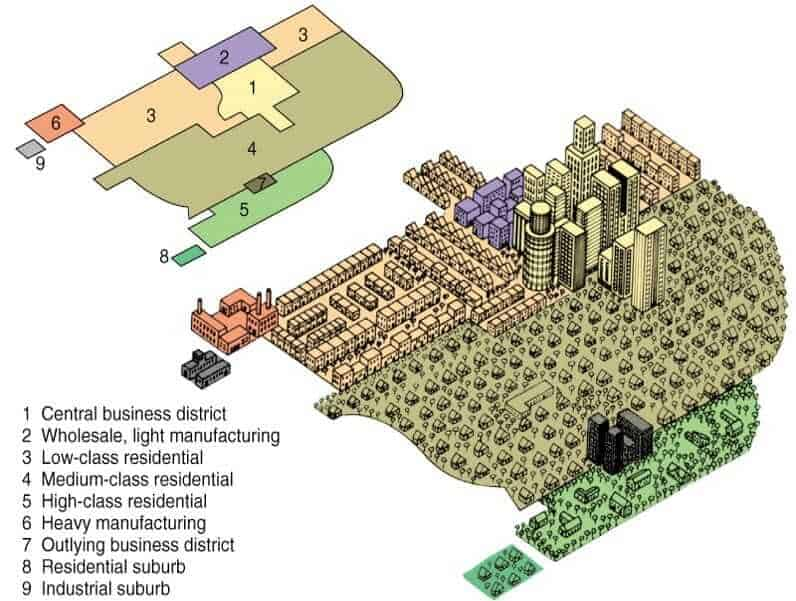
- Multiple Nuclei Model (Harris & Ullman, 1945):5 Argues that modern cities don’t have just one center but several “nuclei” (e.g., a university, an airport, or a mall) that attract specific types of land use around them.
- Bid-Rent Theory: A purely economic model stating that land price is highest at the center. Different users (retail vs. residential) “bid” for space, and the one who can pay the most wins the best location.6
2. Practice: The Reality on the Ground
In practice, land use is rarely as orderly as a diagram. Several “real-world” forces distort the theoretical models:7
Political and Legal Constraints
- Zoning Laws: Theories assume land goes to the “highest bidder,” but in practice, a city might zone a valuable downtown plot as a “historic park,” preventing a skyscraper from being built there regardless of its economic value.
- Political Will: Development is often influenced by “Not In My Backyard” (NIMBY) movements or political lobbying, which can force industrial or low-income housing into areas that don’t make sense theoretically.
Physical and Historical Inertia
- Geography: Cities are built on coasts, hills, and marshes. A theoretical “ring” of housing is impossible if half the city is underwater or on a cliffside.
- Path Dependency: Once a subway line or a highway is built, the city is “locked” into a certain growth pattern. It is incredibly expensive to change land use once infrastructure is in the ground.
Modern Urban Realities
- The Digital Shift: Theories like Bid-Rent were built on the idea that everyone must go to the CBD to work. Remote work and e-commerce have decoupled “location” from “function,” making city centers less dominant than they were in 1925.
- Informal Settlements: In the Global South, a huge portion of land use occurs through “informal” or “slum” development, which ignores official planning theories entirely.
Summary Table: Theory vs. Practice
| Feature | Theory (The Model) | Practice (The Reality) |
| Logic | Economic efficiency and profit. | Political compromise and social values. |
| Growth | Smooth rings or predictable sectors. | Fragmented, “leapfrog” development and sprawl. |
| Center | Single, dominant CBD. | Polycentric (many hubs) or decentralized. |
| Land Value | Determined by distance to the center. | Determined by school districts, safety, and amenities. |
Is there a relationship between cities and societies?
The relationship between cities and societies is symbiotic and cyclical.1 In the simplest terms: societies build cities, and then cities shape societies.
This relationship is a central theme in urban sociology, summarized by Winston Churchill’s famous observation: “We shape our buildings; thereafter they shape us.”2
1. How Society Shapes the City
A city is a physical manifestation of a society’s values, technology, and power structures.3
- Economic Needs: Industrial societies build cities around factories and ports. Post-industrial societies build them around “knowledge hubs” like universities and tech parks.4
- Power Structures: Historical cities often placed the palace or temple at the center to show divine or political authority. Today, corporate skyscrapers often dominate the skyline, reflecting the power of global finance.
- Social Values: If a society values privacy and car ownership, it creates suburban sprawl. If it values collective life and sustainability, it builds dense, walkable neighborhoods with public transit.
2. How the City Shapes Society
Once built, the environment dictates how people live, work, and interact.5
- The “Blasé Attitude”: Sociologist Georg Simmel argued that the sheer “sensory bombardment” of the city (noise, crowds, lights) forces city dwellers to become more reserved and detached as a psychological defense mechanism.6
- Social Diversity & Tolerance: Because cities pack different kinds of people into small spaces, they often act as “engines of tolerance.” Residents are forced to navigate diversity daily, which can lead to more cosmopolitan and progressive social attitudes.
- Weak vs. Strong Ties: Research shows urbanites tend to have wider but shallower social networks. You might know 100 people casually (weak ties) but have fewer deep, multi-generational family connections (strong ties) than someone in a rural village.7
- Economic Specialization: High population density allows for extreme specialization. In a small town, you might have one “general” doctor; in a city, you can find a surgeon who specializes only in left-handed guitar players’ wrist injuries.
3. The Urban Paradox
Urbanization creates a strange contradiction in human behavior:
- Hyper-Connectivity: You are never alone; you are surrounded by thousands of people.
- Hyper-Isolation: You can be surrounded by thousands of people and feel more lonely than you would in the country because those interactions are “secondary” (transactional) rather than “primary” (personal).
Comparison: Urban vs. Rural Social Structures
| Feature | Rural Society | Urban Society |
| Social Ties | “Gemeinschaft” (Community): Deep, personal, and family-based. | “Gesellschaft” (Society): Large-scale, impersonal, and contract-based. |
| Identity | Often defined by lineage and “where you come from.” | Often defined by occupation, subculture, and “what you do.” |
| Social Control | Informal (gossip, family pressure). | Formal (police, laws, professional codes). |
| Innovation | Traditional; slower to change. | Rapid; cities are the “laboratories” of social change. |
What are the basic form of a society?
In sociology, the “basic forms” of a society are typically classified by their subsistence strategy—how the people in that society provide for their basic needs like food and shelter.1
Sociologist Gerhard Lenski argued that technology is the primary driver of this evolution.2 As a society’s tools become more complex, its population grows, its labor becomes more specialized, and its social inequality usually increases.3
1. Pre-Industrial Societies4
These societies rely on human or animal labor and the natural environment.5
- Hunter-Gatherer: The oldest form of society. These are small, nomadic groups (usually 40 or fewer people) based on kinship.6 They have almost no social hierarchy because they cannot store a surplus of food; everyone must contribute to survival.7
- Pastoral: These societies rely on the domestication of animals (like sheep or cattle).8 Because they can breed animals for food and clothing, they create a surplus, which leads to the first signs of social inequality—some families own more “wealth” (livestock) than others.9
- Horticultural: Similar to pastoral societies, but they focus on cultivating plants using hand tools.10 They form more permanent settlements than hunter-gatherers but relocate once the soil is depleted.
- Agrarian (Agricultural):11 Emerging around 5,000 years ago, these societies used the plow and animal power to farm on a massive scale.12 This “dawn of civilization” allowed for huge populations, the rise of cities, and extreme social stratification (lords vs. peasants).
2. Industrial Societies
The Industrial Revolution (1700s–1800s) shifted the focus from animal power to mechanical power.13
- Production: Wealth is generated through the mechanized manufacturing of goods.14
- Urbanization: People moved from farms to cities to work in factories, forever changing the social fabric from close-knit communities to more impersonal, “contract-based” urban lives.
- Social Change: Education became more standardized, and for the first time, a person’s occupation (rather than their family name) became their primary source of identity.
3. Post-Industrial (Information) Societies
Most modern Western nations are now in this stage.
- Focus: The economy is based on the production of information and services rather than physical goods.15
- Class Structure: Social standing is tied to higher education and technical skills. Power shifts from those who own factories to those who control information (tech moguls, researchers, and financial experts).
Summary: The Evolution of Complexity
| Society Type | Key Technology | Size/Settlement | Social Inequality |
| Hunter-Gatherer | Basic tools (spears, baskets) | Nomadic; very small | Low (Egalitarian) |
| Pastoral/Horticultural | Domestication; hand tools | Semi-nomadic; small | Moderate |
| Agrarian | The Plow; animal labor | Permanent; large cities | High (Caste/Class) |
| Industrial | Steam engine; factories | Urban; very large | Moderate (Class-based) |
| Post-Industrial | Computers; the Internet | Global; mega-cities | High (Skills-based) |
Key Distinction: Sociologists often use the terms Gemeinschaft (community) to describe the personal, traditional bonds of pre-industrial societies, and Gesellschaft (society) to describe the impersonal, task-based relationships of industrial and post-industrial life.16
What is the transformation of market exchange?
In sociology and economics, the transformation of market exchange refers to the historical and ongoing process by which economic transactions shifted from being deeply “embedded” in social and personal relationships to being “disembedded” as impersonal, self-regulating systems.1
This transformation is best understood through three distinct lenses: the shift in social logic, the evolution of market forms, and the modern digital revolution.
1. The Sociological Lens: Karl Polanyi’s “Great Transformation”
Economist Karl Polanyi famously argued that markets were not always the center of human life.2 He identified three stages of economic integration:3
- Reciprocity: Early societies exchanged goods based on mutual obligation and social ties (e.g., gift-giving).4 The “market” was a minor social event, not a survival mechanism.
- Redistribution: Central authorities (like a chief or a state) collected goods and shared them out based on status or need.5
- Market Exchange (The Transformation): In the 19th century, society underwent a “Great Transformation” where the economy became disembedded.6 Instead of the economy serving society, social relations were reshaped to serve the market.7
Key Concept: Polanyi noted that for a market to truly function, “fictitious commodities”—Land, Labor, and Money—had to be treated as things for sale, even though they aren’t produced for sale.8 This led to a “Double Movement”: as markets expanded, societies pushed back with regulations (like child labor laws) to protect themselves.9
2. The Historical Lens: From Barter to Global Finance
The physical form of how we exchange goods has evolved through four major stages:
- Barter and Local Fairs: Direct exchange of goods (cow for grain) or localized markets tied to agricultural cycles.10
- The Rise of Currency: Standardized money allowed for “impersonal” trade. You no longer needed to know the merchant to trust the value of what you were receiving.
- The Merchant Era & Stock Exchanges: In the 1500s–1700s, companies like the Dutch East India Company pioneered joint-stock ownership.11 Market exchange was no longer just about physical goods, but about trading risk and future value.
- The Industrial Revolution: Exchange became global and high-volume. The “market” moved from the town square to international shipping lanes and dedicated exchanges (like the NYSE).
3. The Digital Lens: Platformization and Algorithms
Today, we are witnessing a “second transformation” driven by technology:
- Platformization: Exchange is now mediated by “digital landlords” (Amazon, Uber, Airbnb). These platforms don’t just host markets; they set the rules, control the data, and take a “rent” on every transaction.
- The Death of Distance: In traditional theory, location (the “Central Business District”) determined land value and market access. Digital exchange has made geography nearly irrelevant for many goods.
- Algorithmic Pricing: We have moved from “haggling” (personal) to “fixed prices” (industrial) and now to dynamic/algorithmic pricing (digital), where the price of a flight or a ride changes every second based on data.
Summary: The Nature of the Shift
| Feature | Pre-Transformation | Post-Transformation | Digital Transformation |
| Primary Logic | Social Obligation | Profit Maximization | Data & Network Effects |
| Price | Determined by Tradition | Determined by Supply/Demand | Determined by Algorithms |
| Trust | Personal (I know you) | Institutional (I trust the law) | Technical (I trust the rating/code) |
| Market Role | Auxiliary to life | Central to life | Infrastructure of life |
What is the relative importance of different modes of exchange?
In sociology and anthropology, the relative importance of a mode of exchange is not measured by its dollar value, but by its centrality to social survival and stability.
While the “Market” dominates modern global headlines, other modes of exchange remain the “invisible glue” that keeps societies functional. Following the framework of Karl Polanyi and Marshall Sahlins, we can rank the importance of three primary modes across different contexts.
1. Reciprocity: The Moral Backbone
Reciprocity is the exchange of goods and services between people of equal status. It is the most important mode for maintaining social bonds.
- Generalized Reciprocity: (e.g., parents raising children, sharing food with friends). No immediate return is expected.1 This is the foundational mode of the family unit. Without it, the basic building block of society would collapse.
- Balanced Reciprocity: (e.g., birthday gift exchanges, carpooling). An equal return is expected within a reasonable timeframe.2 This maintains trust and cooperation between peers and neighbors.
- Significance Today: Even in a hyper-capitalist city, reciprocity handles the vast majority of “labor” within households (childcare, cleaning, emotional support) that the market cannot efficiently price.
2. Redistribution: The Engine of Equity
Redistribution involves a central authority collecting resources and then dispersing them back to the community.3
- In Ancient Societies: A chief or king collected the harvest to ensure everyone had enough during a drought. This was the primary mode for large-scale survival.
- In Modern Societies: This is the role of the State through taxation, social security, and public schools.
- Significance Today: It is the primary tool for mitigating inequality. Without redistribution, the market’s “winners-take-all” logic would eventually lead to social unrest. It is the mode of exchange that provides the “social safety net.”
3. Market Exchange: The Driver of Efficiency
Market exchange is the exchange of goods for money based on supply and demand.4 It is impersonal and requires a standardized currency.
- Primary Function: It allows for extreme specialization. Because of the market, you don’t need to know the person who made your phone or grew your coffee. It facilitates global cooperation between billions of strangers.
- Significance Today: It is the dominant mode for resource allocation and wealth generation. However, sociologists like Polanyi argue that if the Market becomes too important (dominating land, labor, and nature), it can destroy the social fabric (Reciprocity) and the environment.
Summary Table: Which Mode Matters Most?
| Context | Most Important Mode | Why? |
| Survival of the Individual | Reciprocity | Family and friends provide the safety net in personal crises. |
| Stability of the Nation | Redistribution | It ensures public infrastructure and basic welfare. |
| Global Economic Growth | Market Exchange | It enables mass production and technological innovation. |
| Ancient/Tribal Life | Reciprocity/Redistribution | Markets were often peripheral “fairs” rather than central to life. |
The “Embeddedness” Rule
The relative importance of these modes is shifting. In the past, the Market was embedded in Society (controlled by social rules). Today, many argue Society is embedded in the Market (social life is controlled by economic rules). This shift is what scholars call “Market Society.”
Is there a process of city building?
The process of city building is rarely a single, linear event. Instead, it is a continuous cycle that operates on two levels: the Top-Down (formal planning and engineering) and the Bottom-Up (social evolution and organic growth).
Sociologists and planners generally break this process into four distinct phases.
1. The Pre-Conditions (Prerequisites)
Before a city can even begin to “build,” three things must be present, as identified by sociologist Gideon Sjoberg:1
- A Favorable Environment: Access to fresh water, a stable climate, and defensible terrain.2
- Advanced Technology: Specifically, agricultural tools that allow a small group of people to produce a food surplus.3 If everyone has to farm to survive, no one can move to a city to become a builder, priest, or merchant.
- Social Organization: A power structure (government or religion) capable of coordinating large groups of people to build shared infrastructure like walls, granaries, or irrigation.
2. The Formal Planning Process (Top-Down)4
In modern times, city building follows a highly regulated “Development Spiral.” It is not just about laying bricks, but about navigating a complex web of legal and technical steps.5
| Stage | Activity | Goal |
| 1. Assessment | Analyzing demographics, traffic, and environmental impact. | To understand what the city needs. |
| 2. Zoning & Vision | Deciding which land is for houses, shops, or parks. | To create a “Master Plan.” |
| 3. Design & Engineering | Architects and engineers draw blueprints for buildings and utilities. | To ensure safety and functionality. |
| 4. Approvals | Public hearings and government permits. | To align the project with the law and public will. |
| 5. Implementation | The physical construction of roads, sewers, and buildings. | To turn “paper” into “place.” |
3. The Organic Process (Bottom-Up)
While planners draw maps, society actually “builds” the city’s character through daily use. This is called Human Ecology.
- Succession: As a city grows, new groups of people move into an area, changing its use (e.g., an old industrial warehouse district turning into a trendy arts neighborhood).
- Informal Building: In many parts of the world, city building happens without permits. People build “informal settlements” (slums or favelas) based on immediate need. Over decades, these often become permanent, vibrant parts of the city that the government eventually has to formalize.
4. The Maintenance and Renewal Phase
A city is never “finished.” It is a living organism that must constantly be repaired and reinvented.
- Infill: Building on vacant lots within the existing city rather than expanding outward.
- Gentrification/Regeneration: The process of renovating older, often neglected neighborhoods to accommodate new economic needs, which often triggers social tension.
- Sustainability: Modern city building now focuses on “Smart Cities”—using data and green technology to ensure the city doesn’t collapse under its own environmental weight.
Summary: The Dual Nature of City Building
- The Shell: The physical buildings and roads (the focus of architects and engineers).
- The Soul: The social networks, culture, and economic activities (the focus of sociologists and residents).
What is cost behavior of the single firm?
In the context of urban land use and economics, the cost behavior of a single firm describes how a firm’s total costs change as it adjusts two key variables: its output level and its location (distance from the city center).
While standard accounting looks at costs relative to volume, urban theory adds the dimension of geography.
1. Accounting Perspective: Volume-Based Costs
At its most basic, a firm’s cost structure is divided by how expenses react to production volume.1
- Fixed Costs: Costs that remain constant regardless of output (e.g., the base rent for a factory, insurance, or salaries of permanent staff).2
- Variable Costs: Costs that change in direct proportion to production (e.g., raw materials, electricity used for machines, and hourly labor).3
- Step-Fixed Costs: Costs that stay constant for a certain range of production but “jump” to a higher level when capacity is reached (e.g., hiring an additional supervisor or renting a second warehouse).4
2. Urban Economic Perspective: Location-Based Costs
In urban land use theory, a firm’s cost behavior is dominated by the trade-off between Land Rent and Transportation Costs. This is the core of Bid-Rent Theory.
The Location Trade-off
A firm’s total “locational cost” is the sum of its rent and its transport expenses:
$$Total\ Locational\ Cost = (Rent \times Land\ Area) + (Transport\ Cost \times Distance)$$
- At the City Center (CBD): Land rent is extremely high, but transportation costs (to reach customers or suppliers) are low. Firms here exhibit capital-land substitution—they build “up” (skyscrapers) to use less expensive land more intensely.
- At the Periphery (Suburb/Rural): Land rent is low, but transportation costs are high. Firms here use land “extensively” (sprawling single-story warehouses).
3. Agglomeration and External Cost Behavior
A single firm’s costs are also affected by the behavior of other firms nearby. This is known as Agglomeration Economies.
- Positive Cost Behavior (Decreasing Costs): When a firm locates near others in its industry, its costs may actually decrease due to:
- Labor Pooling: Lower costs to find and train specialized workers.
- Input Sharing: Being close to specialized suppliers reduces shipping times and costs.5
- Knowledge Spillovers: “Learning” from neighbors reduces R&D or operational errors.6
- Negative Cost Behavior (Increasing Costs): As a city becomes too crowded, a firm faces Agglomeration Diseconomies, where costs rise due to:
- Congestion: Traffic delays increase transport costs.
- Competition: High demand for limited local labor and land drives up wages and rents.
Summary: The Firm’s Cost Optimization
| Cost Type | Behavior in the Center | Behavior in the Periphery |
| Land Rent | High (Primary fixed cost) | Low (Minor cost) |
| Transportation | Low (Centralized access) | High (Increased fuel/time) |
| Labor | High (Commuter premium) | Moderate (Local pool) |
| Infrastructure | Shared (Lower per-unit cost) | Private (Higher setup cost) |
What is Scale of Economies and what is Discontinuities of the Single Firm?
In urban economics, the terms Scale of Economies and Discontinuities explain how a firm grows and where it chooses to sit on a map. While “Scale” describes the smooth benefits of getting bigger, “Discontinuities” explain why growth often happens in sudden, uneven “leaps.”
1. Economies of Scale (The “Smooth” Benefit)
Economies of Scale occur when the average cost per unit falls as the firm increases its total output.1 For a single firm, this usually happens for two reasons:
- Fixed Cost Spreading: A firm has certain costs (like rent for a factory or the price of a massive industrial oven) that don’t change whether they make 1 item or 1,000.2 As they produce more, each item “carries” a smaller slice of that fixed cost.3
- Specialization (Division of Labor): In a small firm, one person might do marketing, accounting, and assembly.4 In a large firm, people specialize in one task, becoming faster and more efficient, which lowers the cost of production.
Key Distinction: > * Internal Economies: Advantages a firm creates for itself (e.g., buying a better machine).5
- External Economies: Advantages a firm gets from being in a city (e.g., being near a specialized labor pool or high-speed internet infrastructure).6
2. Discontinuities of the Single Firm (The “Discrete” Leap)
In textbook theory, firms grow “smoothly.” In reality, growth is discontinuous. A firm cannot simply add “half a machine” or “half an office building” to grow by 5%. This leads to several types of “breaks” in their cost and growth behavior:
A. Technical Indivisibilities
Most productive assets come in “chunks.” If a bakery is currently at 100% capacity and wants to grow, it cannot buy 10% more oven. It must buy a whole second oven.
- This creates a discontinuity in costs: costs spike suddenly while output hasn’t yet caught up, making the firm temporarily less efficient until it fills that new capacity.
B. Spatial Discontinuities
In the context of land use, a firm cannot always expand its current building.
- If a law firm in a skyscraper needs more space but the floor above is taken, they may have to move their entire operation or open a second branch elsewhere.
- The firm’s “form” doesn’t stretch; it snaps into a new configuration. This “leapfrogging” creates a fragmented footprint rather than a smooth, continuous expansion.
C. Threshold Growth
Firms often stay the same size for a long time despite growing demand because the “sunk cost” of jumping to the next level (e.g., moving to a larger city or building a new factory) is too high. They only grow when the potential profit crosses a threshold that justifies the massive, sudden investment of a new “chunk” of scale.
Summary Comparison
| Feature | Economies of Scale | Discontinuities |
| Visual Shape | A smooth, downward-sloping curve. | A “staircase” or “step” function. |
| The “Cause” | Spreading costs and specialization. | “Lumpy” assets (ovens, buildings, staff). |
| Growth Style | Continuous and incremental. | Discrete “leaps” followed by plateaus. |
| Urban Impact | Leads to large, concentrated hubs. | Leads to fragmented or “leapfrog” land use. |
What is Transportation Costs of the Single Firm?
In urban land use theory, Transportation Costs are more than just the price of fuel; they are the “cost of distance” that dictates where a firm can survive. For a single firm, these costs are usually categorized into two distinct buckets: Terminal Costs and Line-Haul Costs.1
1. The Structure of Transport Costs
The total transportation cost for a single firm is defined by a “stepped” linear function:
- Terminal Costs (The Fixed “Chunk”): These are the costs incurred regardless of the distance traveled.2 They include loading/unloading, paperwork, packaging, and the time a vehicle spends sitting idle at a warehouse or port.3
- Significance: High terminal costs (like those for rail or ships) make short trips incredibly expensive and inefficient.4
- Line-Haul Costs (The Variable Cost): These are the costs that increase with every mile traveled. They include fuel, driver wages, and wear-and-tear on the vehicle.
- Significance: The “rate” of line-haul costs determines how far a firm can effectively reach its market.
2. The “Tug-of-War”: Procurement vs. Distribution
A firm deals with two separate transport flows. The balance between them determines its ideal location:
- Procurement Costs (PC): The cost of bringing raw materials to the factory.5
- Distribution Costs (DC): The cost of sending finished goods to the market.6
The Locational Choice:
- Resource-Oriented Firms (Weight-Losing): If the raw materials are much heavier or bulkier than the finished product (e.g., a steel mill or a lumber yard), the firm will locate near the source. It is cheaper to move the light finished product than the heavy raw materials.
- Market-Oriented Firms (Weight-Gaining): If the finished product is heavier, more fragile, or more perishable than the inputs (e.g., a soda bottling plant or a bakery), the firm will locate near the consumer.
3. The Transport-Land Trade-off
For a single firm in an urban area, transportation costs have an inverse relationship with Land Rent. This is the fundamental trade-off of urban geography:
- At the CBD (Center): High Land Rent + Low Transport Costs.
- At the Periphery (Edge): Low Land Rent + High Transport Costs.
The “Friction of Distance”: As transport technology improves (making it cheaper/faster to move goods), the “friction” of being far from the center decreases. This is why firms have historically moved from dense city centers to the suburbs—the savings in rent eventually outweighed the (declining) cost of transportation.
Summary: Transport Mode Comparison
| Mode | Terminal Cost | Line-Haul Cost | Ideal Distance |
| Truck (Road) | Low | High | Short |
| Train (Rail) | Medium | Medium | Medium-Long |
| Ship (Water) | High | Low | Very Long |
Is there a relationship between economic costs and city building?
Yes, the relationship between economic costs and city building is fundamental and determining. Economic costs do not just influence the city; they act as the “genetic code” that dictates its shape, density, and growth patterns.
In urban economics, this relationship is often analyzed through the lens of Efficiency vs. Accessibility.
1. Cost as the Architect of Urban Density
The physical structure of a city (how tall the buildings are and how close they sit) is a direct response to land costs.
- Capital-Land Substitution: In areas where land is extremely expensive (like a city center), developers substitute “land” for “capital.” Instead of buying more dirt, they buy more steel and concrete to build upward.
- The Result: High economic costs create a vertical city. Low economic costs at the edge of the city lead to horizontal sprawl, where it is cheaper to build “out” than “up.”
2. Infrastructure Costs and the “Sprawl Tax”
The way a city is built determines its long-term “operating costs.” There is a documented relationship between urban form and public sector costs:
- Low-Density Sprawl: Is economically “expensive” for the city. It requires more miles of road, more piping for water/sewer, and longer routes for trash pickup and emergency services per person.
- High-Density Compactness: Offers economies of scale.1 Providing services to 1,000 people in one apartment block is significantly cheaper than providing those same services to 1,000 people in 1,000 separate houses.
- The Gap: Studies suggest that sprawling development can increase infrastructure and public service costs by 10% to 40% compared to smart, compact growth.
3. Transportation Costs as the “Limit of Growth”
A city can only grow as large as its transportation costs allow.
- The Time/Money Budget: Most people have a fixed “budget” for how much time or money they will spend on a daily commute. If transport costs (fuel or transit fares) rise, the city “shrinks” because distant land becomes too expensive to reach.
- Investment as a Catalyst: When a city builds a new subway or highway, it effectively lowers the transport cost of the land near the new stations. This creates a “Value Uplift,” leading to a sudden burst of city building (new offices and apartments) in those specific spots.
4. Agglomeration: The Benefit of Paying High Costs
If city centers are so expensive, why do firms still build there? The answer lies in Agglomeration Economies.
- The Trade-off: Firms pay high “internal costs” (rent and high wages) in exchange for lower “external costs” (easier access to specialized suppliers, a massive talent pool, and “knowledge spillovers”).2
- The Cycle: As long as the productivity gain from being in a dense city is higher than the cost of rent and congestion, the city will continue to build and densify.
Summary: Economic Drivers of the Built Environment
| Economic Factor | Impact on City Building |
| Rising Land Value | Leads to high-rise construction and smaller unit sizes. |
| Lower Transport Costs | Encourages suburban expansion and “leapfrog” development. |
| High Infrastructure Costs | Drives municipal interest in “Infill” and “Smart Growth.” |
| Agglomeration Benefits | Creates “Skyscraper Clusters” and specialized districts (e.g., Wall Street). |
The “Great Transformation” of Costs: Historically, cities were built where transport costs were lowest (ports/rivers). Today, cities are increasingly built where “knowledge costs” are lowest—near universities and tech hubs—even if the physical land is expensive.
What is intraurban spatial organization?
Intraurban spatial organization refers to the internal “geography” of a city—specifically, how different activities (like living, working, and shopping) and the people who perform them are arranged and connected within the city limits.1
While “urban land use” describes what is on the land, “spatial organization” describes the logic and flows that keep those pieces functioning together as a single system.
1. The Core Components
To understand how a city is organized internally, sociologists and geographers look at three primary layers:
- Nodes (The Centers): These are the “anchors” of the city. They include the Central Business District (CBD), industrial parks, university campuses, and suburban shopping hubs.
- Networks (The Connections): The streets, subway lines, and digital infrastructure that link the nodes. The efficiency of these networks determines the “accessibility” of different parts of the city.
- Flows (The Movement): The actual movement of people (commuting), goods (freight), and information between the nodes. A city with high “spatial organization” has smooth flows; a “disorganized” city suffers from constant congestion.
2. Models of Intraurban Organization
Historically, researchers have used three classic models to describe how cities organize themselves. These models represent the transition from a single-center city to the complex, multi-hub cities we see today.
- Concentric Organization (The Ring): Focuses on a single dominant center (CBD) where everything radiates outward.2 Social class and land value are determined strictly by distance from the center.
- Sectoral Organization (The Wedge): Organization follows transportation corridors (like a main highway or rail line). Similar activities (like high-end housing or heavy industry) cluster along these “spokes.”
- Polycentric Organization (The Multi-Hub): Modern cities often have multiple centers. You might live in one suburb, work in a “Tech Park” in another, and go to the “Historic Center” only for entertainment.
3. The Forces that “Organize” the Space
Why does a city look the way it does? Intraurban organization is the result of a constant “tug-of-war” between two forces:
Centripetal Forces (Pulling In)
- Agglomeration: The economic benefit of being close to other similar businesses (e.g., all the theaters in one district or all the banks in another).3
- Accessibility: The desire to be at the “most reachable” point for the most people.
Centrifugal Forces (Pushing Out)
- Congestion & Rent: As the center becomes too crowded and expensive, activities that require lots of space (like manufacturing or large family homes) are pushed to the edge.
- Negative Externalities: Pollution, noise, and crime can push residents away from industrial or high-density zones.
4. Summary: Structure vs. Organization
| Term | Focus | Key Question |
| Urban Structure | The Physical Form | “Where are the buildings and roads?” |
| Spatial Organization | The Functional Logic | “How do people and goods move between them?” |
Modern Shift: We are currently moving from spatial organization based on distance (how close am I to the center?) to organization based on connectivity (how fast can I get to the internet or a transit hub?).
What is the competitive building process?
In urban land use and economics, the competitive building process refers to the market-driven “tug-of-war” where different potential users (developers, businesses, and residents) bid against one another for the right to use a specific piece of land.1
This process ensures that, in a free market, land is eventually put to its Highest and Best Use (HABU)—the use that generates the most economic value.2
1. The Mechanics of Competition
The process follows a specific economic logic that determines what actually gets built on a plot of land:
- Bid-Rent Competition: As you saw in earlier sections, every potential user has a “bid-rent curve.”3 Because there is only one piece of land, the user who can extract the most profit from that location will offer the highest “bid.”
- Residual Land Value: Developers calculate how much they can pay for land by working backward:$$\text{Residual Land Value} = \text{Market Value of Finished Building} – (\text{Construction Costs} + \text{Profit Margin})$$The developer with the most efficient building design or the highest-paying tenants can afford to pay more for the land, thus winning the “competition.”
2. Stages of the Competitive Process
City building through competition isn’t just a single auction; it’s a multi-stage filter:
| Stage | What Happens | The Competitive Filter |
| 1. Acquisition | Developers bid to buy the raw land or an old building. | Only those with the highest “Highest and Best Use” (HABU) estimates survive. |
| 2. Entitlement | Developers compete for government approval/rezoning. | Competition here is political and legal; who can prove their project “fits” the city’s plan? |
| 3. Design/Efficiency | Architects compete to maximize “rentable square footage.” | The more efficient the building, the lower the per-unit cost, allowing for more competitive pricing. |
| 4. Market Absorption | The finished building competes for tenants or buyers. | The “invisible hand” of the market decides if the building was a success based on occupancy. |
3. What Happens When Competition Fails?
The “Theory” of competitive building assumes a perfect market, but in “Practice,” several factors can distort the process:
- Land Scarcity & Bottlenecks: If the government limits where building can happen (through strict zoning), the competition becomes artificially intense. This drives land prices up, making only “luxury” housing financially feasible for developers to build.
- Barriers to Entry: If the “Competitive Process” is too expensive (high permit fees, years of waiting), small builders are kicked out. Only massive developers who can afford the “wait” remain, leading to a monopoly-like environment.
- Externalities: Competitive building ignores “social costs.” A high-rise might be the most profitable use of land, but it might block the sun for a neighborhood park, creating a conflict between private profit and public good.
4. The Result: A “Self-Organizing” City
When the competitive building process works, it creates a predictable pattern:
- High-Intensity Use at the Center: Skyscrapers and retail (who bid the most).
- Specialized Clusters: Firms in the same industry outbid others to be near each other (e.g., a “Garment District” or “Tech Hub”).
- Gentrification: When the competitive value of a neglected neighborhood’s location becomes higher than its current use, the “Competitive Process” triggers redevelopment, often displacing existing residents.
What is ceiling rents?
In urban economics and land use theory, Ceiling Rents (often referred to as Rent Ceilings) represent a regulatory “lid” placed on the market.1 While the competitive building process naturally pushes rents toward the highest point a tenant can pay, a ceiling rent is a legal limit that prevents the price from reaching that equilibrium.2
This creates a fundamental clash between the Theory of Land Use (which relies on price to organize the city) and the Practice of Social Policy.
1. How Ceiling Rents Work
A rent ceiling is a form of Price Ceiling.3 Its impact depends entirely on where it is set relative to the market:
- Non-Binding Ceiling: If the ceiling is set above the current market rent, it has no effect. The market continues to function as if the ceiling didn’t exist.
- Binding Ceiling: If the ceiling is set below the market equilibrium, it becomes the legal “price.”4 This triggers a chain reaction in how land is used and how the city grows.
2. The Economic Impacts on the Single Firm
When a rent ceiling is imposed, the “Single Firm” (in this case, the landlord or developer) changes its behavior:
- Reduced Supply: Because the return on investment is capped, developers may stop building new rental units.5 They might “exit” the market by converting apartments into condos or office spaces that aren’t subject to the ceiling.
- Maintenance Deterioration: If a firm cannot raise rents to cover rising repair costs (the “cost behavior” we discussed earlier), they often reduce maintenance.6 This leads to the physical decay of the housing stock.7
- Shadow Markets: Often, “black markets” emerge where landlords charge “key money” (under-the-table fees) or require tenants to pay for their own major repairs to bypass the ceiling.
3. Impact on Intraurban Spatial Organization
Ceiling rents act as a “freeze” on the city’s natural evolution:
- Reduced Mobility: Tenants in rent-controlled units are unlikely to move, even if their life circumstances change (e.g., they get a job across town or their children move out).8 This leads to “misallocation,” where people live in homes that don’t fit their needs.9
- Distorted Bid-Rent Curves: Normally, the “highest bidder” wins the land near the center. With a ceiling, the price signal is broken. This can prevent the city from densifying near transit hubs because the economic incentive to rebuild at higher density is removed.
- Tiered Neighborhoods: It can create a “two-tier” city: one group of lucky “insiders” with cheap, protected rents, and a group of “outsiders” (like newcomers or young people) who face even higher prices in the small remaining “uncontrolled” market.
4. Summary: The Trade-off
| Feature | Market Rent (Competition) | Ceiling Rent (Regulation) |
| Primary Goal | Economic efficiency / HABU. | Social stability / Affordability. |
| Housing Supply | Incentivizes new construction. | Often discourages new construction. |
| Tenant Impact | Vulnerable to displacement by price. | Protected from sudden rent spikes. |
| City Form | Rapidly densifies and changes. | Stays static; slower to evolve. |
The “Second Generation” Compromise
Many modern cities use “Second Generation” rent controls. These include exemptions for new buildings (to keep developers building) and vacancy decontrol (allowing the rent to jump to market rate only when a tenant moves out). This is an attempt to balance the social need for stability with the economic need for a functioning building process.10
What is the residential location decision?
In urban economics, the residential location decision is the process by which a household chooses where to live by balancing two competing factors: accessibility (proximity to work and amenities) and space (size and quality of the home).
This decision is often viewed as a trade-off: you can have a large, cheap house far from the city center, or a small, expensive apartment right in the heart of the action.
1. The Economic Theory: The Alonso-Muth-Mills Model
The standard model for this decision is the Monocentric City Model. It assumes that all jobs are in the Central Business District (CBD) and that every household wants to maximize their “utility” (satisfaction) based on their budget.1
The Fundamental Trade-off
The budget of a household is split between three things:
- Housing Costs (Rent/Mortgage): Generally higher near the center.
- Transportation Costs (Commuting): Increases as you move further from the center.2
- Other Goods: Everything else (food, clothing, savings).
The decision-maker moves further away from the center as long as the savings in rent are greater than the increase in commuting costs.
$$Total\ Cost = Rent(Distance) + Commuting(Distance)$$
- Higher-income households often move further out because they value extra space (large backyards) more than the cost of the commute.
- Lower-income households often live closer to the center because, while the rent per square foot is higher, they cannot afford the high time and money costs of a long commute.
2. The Multi-Dimensional Bundle
In practice, people aren’t just buying “land”; they are buying a bundle of attributes. When you choose a location, you are simultaneously choosing:
- The Dwelling: Size, style, number of bedrooms, and age of the building.
- The Neighborhood: Safety, noise levels, and the “vibe” of the community.
- Public Goods: Quality of local schools, proximity to parks, and access to healthcare.
- Social Networks: Proximity to friends, family, or people with similar cultural backgrounds.
3. Factors Influencing the Decision
The “weight” given to different factors varies by a household’s Life Cycle Stage:
| Life Stage | Primary Driver | Typical Location |
| Young Professionals | Accessibility to jobs and nightlife. | Urban center / Dense apartments. |
| Families with Children | School quality and yard space. | Suburbs / Single-family homes. |
| Retirees | Peace, safety, and proximity to healthcare. | Quiet suburbs or specialized “senior” nodes. |
4. Modern Disruptions to the Decision
The classic “distance-to-center” logic is being challenged by new urban realities:
- Polycentric Cities: Most modern cities have multiple “centers” (tech hubs, airport districts). People now choose locations relative to their specific workplace, which may not be downtown.
- Remote Work: If you only go to the office twice a week, the “weight” of commuting costs drops significantly, allowing people to live much further away in search of cheaper, larger homes.
- Location Affordability: Experts now suggest looking at H+T (Housing + Transportation) costs together.3 A “cheap” house in the far suburbs might actually be more expensive than a “pricey” city apartment once you factor in two car payments, fuel, and insurance.
Summary: The Decision Filter
- Can I afford it? (The Budget Constraint)
- How long is the commute? (The Accessibility Constraint)
- Is it big enough? (The Space Constraint)
- Is it a “good” area? (The Quality/Social Constraint)
What are site demands of firms?
In urban economics, site demands refer to the specific requirements a firm must satisfy when selecting a piece of land to ensure its operations are profitable and efficient.
While “Location” (where the firm is in the city) is about distance, “Site Demands” are about the physical and legal characteristics of the plot itself.
1. The “Tug-of-War”: Transport Orientation
The primary site demand for most firms is defined by how they move goods. A firm’s demand is usually oriented toward one of two poles:
- Resource-Oriented (Weight-Losing): If the raw materials are heavier than the final product (e.g., a steel mill or fruit cannery), the firm demands a site close to the input source. It is cheaper to move the light finished product than the heavy raw material.
- Market-Oriented (Weight-Gaining): If the final product is heavier or more fragile than the parts (e.g., a soda bottling plant or a bakery), the firm demands a site near the consumer.
2. Infrastructure and Utility Demands
Firms have much more intense technical requirements than residential users. A site must provide:
- Load-Bearing Capacity: Industrial firms demand specific soil stability and “floor loading” specs to support heavy machinery.
- Utility Intensity: High-voltage electricity, high-capacity water lines, and specialized sewage for industrial waste. A site without these is “useless,” regardless of its location.
- Connectivity: Modern firms demand “digital accessibility” (high-speed fiber) and “physical accessibility” (proximity to intermodal hubs, rail spurs, or highway on-ramps).
3. Agglomeration Demands (The “Clustering” Need)
Firms often demand to be near other firms, a phenomenon called Agglomeration Economies.1
- Localization Economies: Demanding a site near competitors in the same industry to share a specialized labor pool (e.g., a “Fashion District” or “Silicon Valley”).2
- Urbanization Economies: Demanding a site in a large, diverse city to access a wide variety of services (lawyers, accountants, printers) that aren’t available in smaller towns.
4. Institutional and Legal Demands
Even if a site is physically perfect, it must meet legal “demands”:
- Zoning Compliance: The firm demands a site where its specific “Use Class” is allowed. A chemical plant cannot bid for land in a residential zone.
- Future Scalability: Firms often demand “excess land” to allow for future expansion.3 Because the “Discontinuities of the Single Firm” make moving expensive, they would rather buy a larger site now than have to relocate later.
Summary Table: Site Demands by Firm Type
| Firm Type | Primary Site Demand | Key Constraint |
| Retail (Store) | Visibility & Foot Traffic | High Rent / Small Space |
| Manufacturing | Transport & Utilities | Zoning / Large Floor Plates |
| Tech/Office | Labor Access & Connectivity | Amenities / Prestige |
| Warehousing | Highway/Rail Access | Truck Turning Radius / Height |
The “Residual” Nature of Firm Demand
Because a firm’s demand is based on profit, they calculate their “bid” for a site based on what is left over after all other costs (labor, materials, transport) are paid. If the site demands are too high—for example, if a city requires a factory to build expensive green filters—the firm’s “bid” for that land will drop, often leading them to leave the city entirely for a cheaper site at the periphery.
What are market outcomes?
In urban economics, market outcomes are the physical and social end-results produced by the interaction of land buyers, sellers, developers, and residents within a city.
While “Market Exchange” is the process, the Outcome is the actual map of the city—where the skyscrapers are, which neighborhoods are wealthy, and where the traffic jams happen.
1. The Core Market Outcomes
When a land market is left to function on its own (or within a regulatory framework), it consistently produces four major outcomes:
A. Spatial Sorting
The market “sorts” people and businesses into specific areas based on their ability to pay.
- Outcome: You end up with distinct districts—a high-end luxury shopping street, a cluster of tech offices, and “pockets” of low-income housing. This isn’t random; it’s the result of competitive bidding where the highest-value user wins the most accessible land.
B. Land Use Intensity (Density)
The market determines how “thickly” a piece of land is used.
- Outcome: High land prices lead to vertical growth (skyscrapers). Low prices lead to horizontal growth (sprawl). The market outcome is the physical “skyline” of the city.
C. Resource Allocation
The market decides what the city is at any given moment.
- Outcome: If the demand for housing is higher than the demand for office space, the market outcome will be the conversion of old warehouses into “lofts.” Market outcomes are the “recycling” mechanism of the city.
D. Price Equilibrium
The most visible outcome is the rent or property value.
- Outcome: Prices act as a signal. High prices in one neighborhood tell developers “Build more here,” while falling prices elsewhere signal “This area is in decline; stop investing.”1
2. Market Outcomes vs. Social Outcomes
A major theme in urban studies is the “gap” between what the market wants and what society needs.2
| Feature | Market Outcome (Efficiency) | Social Outcome (Equity) |
| Driver | Profit and individual wealth. | Well-being and public health. |
| Housing | Built for those who can pay the most (Luxury). | Built for those who need it most (Affordable). |
| Public Space | Land is sold for private development. | Land is reserved for parks and plazas. |
| Transport | Optimized for the fastest/most profitable route. | Optimized for universal access (Transit/Walking). |
3. “Failed” Market Outcomes (Externalities)3
Sometimes, the market produces outcomes that are efficient for individuals but bad for the city as a whole. These are called Market Failures:
- Urban Sprawl: From an individual’s perspective, a cheap house far away is a good “market outcome.” For the city, it results in expensive infrastructure and high carbon emissions.
- Gentrification: A successful market outcome for property owners (rising values) can be a social disaster for long-term tenants who are displaced.
- Congestion: When too many firms chase the same “market outcome” of a central location, the result is gridlock that lowers the productivity of everyone.
4. The Role of Policy
Because market outcomes aren’t always socially desirable, cities use Planning to steer the market:
- Incentives: Using tax breaks to encourage a “market outcome” like green building.
- Constraints: Using zoning to prevent a “market outcome” like a factory being built next to a school.
- Direct Provision: Building public parks because the market will almost never choose to leave land empty and “unproductive.”
Summary: A market outcome is the “unfiltered” result of economic competition. It creates highly efficient, productive cities, but often requires government intervention to ensure those cities are also livable and fair.
What are classical models of urban land use?
In urban geography and sociology, there are three “Classical” or “Traditional” models of urban land use.1 Developed between the 1920s and 1940s based on observations of North American cities (particularly Chicago), they explain the relationship between economic activity, social class, and distance from the city center.
1. Concentric Zone Model (Burgess, 1925)2
Sociologist Ernest Burgess viewed the city as a series of five concentric rings radiating from the center.3 This model is based on the idea that land value is highest at the center, forcing a logical “sorting” of people and businesses.4
- Zone 1: Central Business District (CBD): The non-residential “core” with skyscrapers, banks, and major retailers.5
- Zone 2: Zone of Transition: An area of mixed industry and poor-quality housing, often populated by new immigrants.6
- Zone 3: Zone of Working-Men’s Homes: Older, modest homes occupied by stable, blue-collar families.7
- Zone 4: Zone of Better Residences:8 Spacious, middle-class homes and apartments.9
- Zone 5: Commuter Zone:10 The outermost ring consisting of small towns and high-class suburbs for those who can afford the long commute.11
2. Sector Model (Hoyt, 1939)12
Economist Homer Hoyt modified the Burgess model after observing that cities don’t grow in perfect circles.13 Instead, they grow in wedges or sectors centered on major transportation routes like rail lines, highways, or rivers.14
- Logic: Once a high-rent residential area or an industrial zone is established, it tends to expand outward along the same “spoke” of the wheel.
- Layout: Industrial sectors often sit alongside rail lines, while low-income housing borders the industrial wedge (due to noise and pollution).15 High-income housing develops on the opposite side of the city, as far from industry as possible.16
3. Multiple Nuclei Model (Harris & Ullman, 1945)17
By the mid-20th century, geographers Chauncy Harris and Edward Ullman realized that modern cities had become too complex for a single center.18 They argued that cities develop around several nuclei (nodes), such as a university, an airport, or a shopping center.
- Decentralization: The CBD loses some of its dominance. A factory might attract a cluster of low-income housing near an airport, while a university attracts its own specific businesses and student housing miles away.
- Clustering: Similar activities cluster together (like financial districts), while incompatible activities stay apart (like heavy industry and high-end residential estates).
Summary Comparison
| Model | Shape | Key Driver | Center |
| Concentric | Bull’s Eye | Bid-Rent & Social Class | Single (CBD) |
| Sector | Pie Slices | Transportation Corridors | Single (CBD) |
| Multiple Nuclei | Irregular Blocks | Specialized Activity Nodes | Multiple Nodes |
This Classical Urban Land Use Models overview provides a detailed visual breakdown of how these three theories describe city growth.
What is the concentric zone model?
The Concentric Zone Model, also known as the Burgess Model, was the first major theoretical framework used to explain how social groups are distributed within a city. Developed by sociologist Ernest Burgess in 1925, the model was based on his observations of Chicago during a period of rapid industrialization and immigration.
The model views the city as an ecosystem that grows radially outward from a central point, forming five distinct rings (or zones).
1. The Five Zones of the City
Burgess identified a specific social and economic character for each ring:
- Zone 1: Central Business District (CBD): The “Loop” or downtown core. It contains the highest land values, skyscrapers, banks, and major retail. Almost no one lives here.
- Zone 2: Zone of Transition: The most unstable area. It contains older housing, small factories, and “slums.” This is where new immigrants typically settle due to low rents. It often has the highest rates of crime and social disorganization.
- Zone 3: Working-Class Residential Zone: Often called the “inner suburbs.” It is inhabited by blue-collar workers and second-generation immigrants who have “escaped” the transition zone for better living conditions but still need to be close to factory jobs.
- Zone 4: Residential Zone: Dominated by middle-class families. The housing consists of newer, more spacious single-family homes or high-end apartments. Residents here are often white-collar professionals.
- Zone 5: Commuter Zone: The outermost ring, consisting of wealthy suburbs and satellite “commuter towns.” Residents here are the most affluent and can afford the high time and money costs of a long daily commute to the CBD.
2. The Logic of the Model: “Invasion and Succession”
Burgess applied concepts from Ecology to explain how cities grow. He argued that the city is in a constant state of “metabolism”:
- Invasion: As the CBD (Zone 1) grows, it pushes into the Transition Zone (Zone 2).
- Succession: The people in the Transition Zone then “invade” the Working-Class Zone (Zone 3), eventually replacing the previous inhabitants.
- Result: This creates a “ripple effect” where every zone is constantly expanding outward, like waves in a pond.
3. Key Theoretical Drivers
- Bid-Rent Theory: The model assumes that land at the center is the most expensive because it is the most accessible. Only commercial businesses can afford the highest rents at the center, while residents “bid” for land further away where it is cheaper.
- Economic Status vs. Distance: In this model, wealth increases as distance from the center increases. This was a defining characteristic of 20th-century American cities.
4. Why it is Criticized Today
While foundational, the model has several limitations when applied to modern or international cities:
- The Isotropic Plain Assumption: It assumes the land is perfectly flat. In reality, rivers (like the Chicago River), mountains, or lakes distort the “rings” into semicircles or irregular shapes.
- Modern Transportation: Highways and cars have allowed for “Leapfrog Development,” where wealthy suburbs can pop up far beyond the commuter zone, breaking the ring pattern.
- Gentrification: The model predicts that the inner city is always the poorest. However, modern gentrification sees wealthy residents moving back into Zone 2 and Zone 3, inverting the model.
- Polycentric Cities: Most modern cities have multiple “centers” (edge cities or tech hubs), meaning they no longer revolve around a single CBD.
Would you like to compare this to the Sector Model, which explains how transportation routes like railroads changed these rings into “pie slices”?
This explanation of the Concentric Zone Model provides a clear visual breakdown of how each zone functions and the economic logic Burgess used to map 1920s Chicago.
The Concentric Zone Model (Easiest Explanation) – YouTube
What is the sector model?
The Sector Model, also known as the Hoyt Model, is a classic theory of urban land use proposed by land economist Homer Hoyt in 1939.1 It was developed as a refinement of the earlier Concentric Zone Model (Burgess Model).2
While Burgess suggested that cities grow in perfect rings, Hoyt argued that cities develop in sectors or wedges that radiate outward from the center, primarily following major transportation routes like railroads, highways, and rivers.3
1. The Structure of the Model
In the Sector Model, the city is still anchored by a Central Business District (CBD), but different types of land use extend from the center to the edge in long “slices” of a pie.4
- Zone 1: Central Business District (CBD): The heart of the city, where commercial and civic activities are concentrated.5
- Zone 2: Transportation and Industry: A sector that follows a major transportation line (like a rail corridor or river).6 Factories and warehouses cluster here to minimize transport costs.7
- Zone 3: Low-Class Residential:8 Located right next to the industrial and transportation sectors.9 Workers live here to be close to their jobs, but they must deal with the noise, traffic, and pollution of the factories.10
- Zone 4: Middle-Class Residential: The largest sector, acting as a “buffer” between the low-class and high-class areas.11 It has better access to the CBD and cleaner environments than Zone 3.12
- Zone 5: High-Class Residential: This sector develops along the most desirable “axis” of the city—often on higher ground, away from industrial pollution, and along “fashionable” boulevards.13 As the city grows, this elite wedge simply extends further out into the countryside.
2. Key Differences from the Concentric Model
The Sector Model introduced two revolutionary ideas that Burgess had ignored:
| Feature | Concentric Zone Model (1925) | Sector Model (1939) |
| Shape | Concentric Rings (Bull’s Eye). | Wedges/Sectors (Pie Slices). |
| Growth Driver | Distance from the center. | Direction along transport lines. |
| Social Logic | Everyone moves out as they get richer. | Like attracts like; a wealthy area stays wealthy as it expands. |
| Industry | Stays in a single ring near the center. | Follows a long corridor out of the city. |
3. The “Inertia” of High-Class Housing
One of Hoyt’s most important findings was that high-rent residential areas lead the way in city growth.14 Once a “fashionable” neighborhood is established on one side of the city, the elite will continue to build further out in that same direction.15 They will never move to the opposite side of the city if it means passing through industrial or low-income zones to get to the CBD.
4. Strengths and Weaknesses
Strengths
- Realistic Growth: It accounts for the “linear” nature of modern cities that grow along highways and rail lines.16
- Directional Focus: It explains why some sides of a city are “nice” while others remain industrial for decades.
Weaknesses
- Pre-Automobile: Like the Burgess model, it was designed before the age of the private car.17 It doesn’t account for “sprawl” that happens away from main corridors.
- Monocentric: It assumes there is only one CBD.18 Modern cities are often polycentric, with multiple office hubs and “Edge Cities.”
- Physical Geography: It assumes a flat plain. Mountains, lakes, or oceans (like Lake Michigan in Chicago) force sectors to bend or stop abruptly.19
This video explains the Sector Model and compares its wedge-based growth to the older concentric ring theory.
What is the multiple nuclei model?
The Multiple Nuclei Model is a classic theory of urban land use proposed by geographers Chauncy Harris and Edward Ullman in 1945.1 It marked a significant shift in urban theory by arguing that modern cities do not revolve around a single center, but rather develop around several independent nodes or “nuclei.”2
This model was a direct response to the limitations of the earlier Concentric Zone and Sector models, which were seen as too simplistic for the automobile-dependent, sprawling cities of the post-WWII era.3
1. The Structure of the Model
In this model, the city is a “cellular” structure where different activities cluster in specific spots across the landscape.4 Instead of one dominant Central Business District (CBD), the city has multiple focal points.5
Typical Nuclei in a City:
- The Original CBD: Still exists but is no longer the only hub.6
- Wholesale/Light Manufacturing: Clusters near transport links like ports or rail yards.7
- Heavy Industrial Districts: Located on the edge of the city to avoid noise and pollution complaints.8
- Residential Suburbs: Wealthy residents move far from the center for space and quiet.
- Outlying Business Districts: Miniature “downtowns” (like shopping malls or office parks) that serve suburban residents.9
- Specialized Hubs: University campuses, airports, or hospitals that attract their own ecosystems of businesses and housing.10
2. Why Do Multiple Nuclei Form?
Harris and Ullman identified four specific reasons why specialized clusters develop:
- Specialized Requirements: Certain activities need specific facilities.11 A factory needs a rail line; a university needs large tracts of land; a port needs a waterfront.
- Mutual Benefit (Agglomeration): Similar businesses like to be near each other. Retail stores cluster to attract more shoppers; tech firms cluster to share a specialized labor pool.12
- Incompatibility: Some activities repel each other.13 High-end residential neighborhoods will never develop next to a heavy industrial plant that produces smoke and noise.14
- Economic Competition: Some users simply cannot afford the high rent of the city center.15 Low-value activities, like bulk storage or junk yards, are pushed to the cheaper outskirts.
3. Real-World Examples
- Los Angeles: Often cited as the ultimate “Multiple Nuclei” city.16 It has a downtown core, but Hollywood (entertainment), Santa Monica (tourism/retail), and Silicon Beach (tech) all act as independent, powerful nuclei.17
- New York City: While Manhattan is the primary core, Brooklyn, Long Island City, and Newark act as secondary nuclei with their own business districts and residential identities.
4. Comparison: Evolution of Urban Theory
| Feature | Concentric (1925) | Sector (1939) | Multiple Nuclei (1945) |
| Shape | Rings | Wedges | Scattered Nodes |
| Main Driver | Walking/Transit distance | Transport corridors | Automobile/Specialization |
| Center | One CBD | One CBD | Many Hubs |
| Key Symbol | The Bullseye | The Pie | The Patchwork Quilt |
Significance Today
The Multiple Nuclei Model laid the groundwork for modern urban concepts like “Edge Cities” and “Galactic Cities,” where the suburbs eventually become more economically important than the original city center.
Multiple Nuclei Model basics
This video provides a visual breakdown of how Harris and Ullman’s model represents the complex, decentralized nature of modern metropolitan areas.
How do we model the Third World city structure?
Modeling cities in the developing world requires moving beyond the classic North American “rings” or “sectors.”1 Because these cities often have a history of colonialism, rapid population growth, and high economic inequality, geographers use specific models for different regions.2
The three most important models are the Latin American, Sub-Saharan African, and Southeast Asian city models.
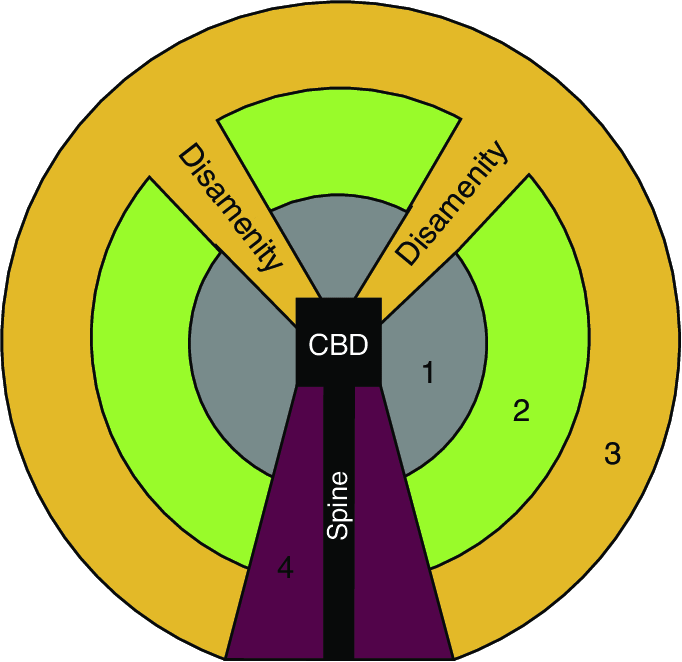
1. The Latin American City Model (Griffin-Ford, 1980)3
This model is unique because it combines elements of “sectors” with “concentric zones.”4 Unlike US cities, the wealthy live in the center and along a prestigious “spine,” while the poor live on the periphery.5
- Commercial Spine: An elite “boulevard” (like the Paseo de la Reforma in Mexico City) that extends from the CBD.6 It is lined with high-end shops, offices, and theaters.
- Elite Residential Sector: The wealthiest residents live immediately surrounding the spine to access its amenities and services.7
- Zone of Maturity: Older, stable housing for the middle class.
- Zone of In Situ Accretion: A transition zone where housing is constantly being improved by residents (self-building).
- Periphery (Squatter Settlements): The outermost ring, consisting of “Favelas” or “Barrios”—informal housing with little to no infrastructure.8
- Disamenity Sector: Poorer parts of the city that can extend all the way to the core, often located in dangerous or undesirable areas like steep hillsides or floodplains.9
2. The Sub-Saharan African City Model (de Blij)10
African cities are often described as having three distinct Central Business Districts, reflecting their complex historical layers.11
- The Colonial CBD: Features a grid pattern and “Western” architecture, left behind by European powers. It remains the formal center for finance and government.
- The Traditional CBD: An informal, open-air marketplace that acts as the hub for local commerce and “street life.”
- The Market Zone: A transitional zone where periodic markets take place.
- Neighborhood Structure: Ethnic and tribal neighborhoods often cluster together. Informal “shantytowns” grow rapidly at the city’s edge to house the constant influx of rural migrants.12
3. The Southeast Asian City Model (McGee, 1967)13
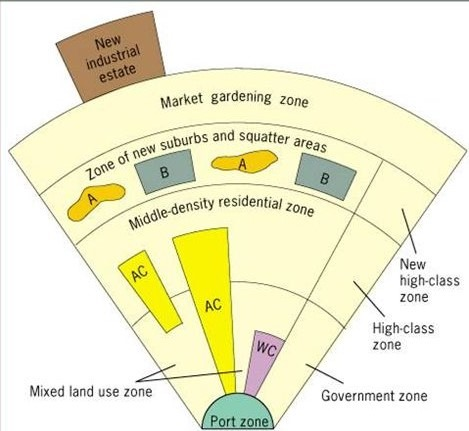
Geographer T.G. McGee noted that many Southeast Asian cities grew up around ports rather than a central land-based downtown.14
- The Port Zone: The true “nucleus” of the city. All commercial activity flows toward the water.
- No Formal CBD: Instead, there are separate clusters: a “Government Zone,” a “Western Commercial Zone,” and an “Alien Commercial Zone” (traditionally dominated by Chinese merchants).15
- Mixed Land Use: Unlike Western cities that separate houses from factories, these cities feature large areas where light industry and residences coexist in the same buildings.
- Market Gardening: A unique zone on the periphery where fresh food is grown specifically for the urban market.
4. Summary: Developing World vs. North American Models
| Feature | Developing World City | North American City |
| Wealth Center | The Elite are in the Center/Spine. | The Elite are in the Suburbs. |
| Growth Speed | Rapid; infrastructure cannot keep up. | Planned; infrastructure leads growth. |
| The Edge16 | Informal “Squatter” settlements.17 | Planned “Bedrooms” (Commuter suburbs). |
| Center | Often Colonial or Port-based. | Commercial Business District (CBD).18 |
The Common “Third World” Pattern
Regardless of the region, almost all developing world cities share the “Dual City” structure: a formal, modern city for the global elite and an informal, self-built city for the majority of the population.
How do we model the Latin America City structure?
Modeling the structure of Latin American cities requires a unique framework that differs significantly from North American models.1 The most widely recognized way to do this is through the Griffin-Ford Model (1980), which accounts for the region’s colonial history and rapid modern urbanization.2
Unlike US cities, where wealth often moves to the suburbs, the Latin American model shows that the elite remain near the center and along a prestigious “spine.”3
1. The Core Components of the Griffin-Ford Model
The model is structured around a central point with both radial sectors (wedges) and concentric zones (rings).4
The Central Business District (CBD) and Market
- The CBD: The functional heart of the city, containing the highest-end offices, government buildings, and luxury retail.5 It is often anchored by a colonial Plaza Mayor.6
- The Market: Usually adjacent to the CBD, this area represents the informal economy. It is a bustling, less regulated zone of street vendors and local trade.
The Commercial Spine and Elite Sector
- The Spine: An extension of the CBD along a grand, tree-lined boulevard.7 This is the city’s most prestigious “axis.”
- Elite Residential: The wealthiest residents live in a wedge-shaped sector immediately surrounding this spine. They have the best access to utilities (water/electricity), private schools, and high-end amenities like golf courses and museums.8
2. The Concentric Zones of Housing Quality9
As you move away from the elite spine and the CBD, the quality of housing and infrastructure generally decreases.10
- Zone of Maturity: Surrounds the CBD. These are older, stable neighborhoods with fully developed infrastructure. They were often the homes of the elite before they moved to the “Spine.”
- Zone of In Situ Accretion: A transitional zone where housing quality varies wildly.11 It is characterized by on-going construction; homes are often half-finished as residents upgrade their dwellings over time as they save money.12
- Peripheral Squatter Settlements: The outermost ring, often located behind a Periférico (ring highway).13 These are “Favelas” or “Barrios”—informal shantytowns built from scavenged materials, initially lacking electricity, clean water, or paved roads.
3. Specialized Features
- Disamenity Sector: This is a unique “wedge” of extreme poverty that can reach from the city’s edge all the way into the core. These areas are located in undesirable terrain like steep hillsides or polluted floodplains and are often controlled by gangs or lack government services.14
- Industrial Park: Often located on the periphery or along a secondary transport axis, reflecting the city’s role in global manufacturing.
Summary of the Spatial Logic
| Feature | Latin American City Pattern |
| Social Status | Decreases as you move away from the center/spine. |
| Infrastructure | Most reliable at the core; pirated or absent at the edge. |
| Elite Location | Central and along the “Spine.” |
| The Edge | Massive, informal settlements (the opposite of the US suburbs). |
This Griffin-Ford Model analysis provides a detailed visual breakdown of how these specific zones represent the socio-economic disparities found across Latin American urban landscapes.
Is there a way to model Southeast Asian city structures?
Yes, geographers model the Southeast Asian city structure using the McGee Model, developed by T.G. McGee in 1967.1
Unlike Western cities that center on a land-based “Downtown” or Central Business District (CBD), the McGee model is built around a Port Zone.2 Because these cities grew as colonial trade hubs, the water—not the land—is the focal point of all economic activity.3
1. The Core Components of the McGee Model
The structure of the Southeast Asian city is more “fragmented” than American or European models. It does not have one single CBD; instead, it has several specialized commercial hubs.4
The Port Zone (The Nucleus)
Everything in the city radiates from the port. This is the gateway to the global economy where exports and imports are processed.
The Commercial Clusters
Instead of one “downtown,” McGee identified three separate commercial areas:
- The Government Zone: Located near the port, containing administrative buildings and colonial landmarks.5
- The Western Commercial Zone: The “modern” part of the city featuring high-rise offices, international banks, and luxury hotels.6
- The Alien Commercial Zone: Traditionally dominated by Chinese or Indian merchants and small business owners.7 This zone consists of “shop-houses” where the business is on the ground floor and the family lives above.
2. The Concentric Zones of Growth
Surrounding these commercial hubs are rings of residential and industrial land use:
- The Mixed Land-Use Zone: A unique feature where light industry (factories) and housing are completely blended together. This is where most of the city’s population lives and works.
- The Suburbs: Newer, middle-class residential areas that have developed as the city expanded.
- Squatter Settlements: Like the Latin American model, Southeast Asian cities feature “informal” housing, but in this model, they are often tucked into the gaps between the formal zones rather than being purely on the periphery.8
- Market Gardening Zone: On the very edge of the city, fresh food is grown specifically for urban consumption.
3. Key Differences from Other Models
| Feature | Southeast Asian Model | North American Model |
| Primary Focal Point | The Port (Maritime). | The CBD (Land-based). |
| Commercial Logic | Fragmented into 3+ distinct zones. | Unified into one Central Business District. |
| Residential Mix | High blend of houses and factories. | Strict separation (zoning) of housing. |
| Agriculture | Features an active “Market Gardening” belt. | Surrounded by “Bedrooms” or sprawl. |
[Image comparing the McGee Model to the Griffin-Ford Latin American Model]
4. Modern Evolution: The “Desakota”
In recent decades, geographers have updated this model to include the Desakota (a village-city hybrid). Because of high population density, the city and the countryside merge into a single, massive landscape of high-speed trains, rice paddies, and industrial parks all sitting side-by-side.
Summary: The McGee model shows a city that is outward-looking. Its spatial organization is designed to move goods from the interior of the country to the global market via the port.
What is a sprawling metropolis and what are its patterns and problems?
A sprawling metropolis is a large urban area where development spreads rapidly across the landscape, far outpacing actual population growth. It is defined by its horizontal expansion rather than vertical density, creating vast “webs” of low-density suburbs and satellite towns.
While a traditional metropolis concentrates people and power in a dense core, a sprawling one fragments these elements over hundreds of square miles.
1. Patterns of Urban Sprawl
Sprawl follows several distinct physical and economic patterns:
- Low-Density Development: The most common pattern is “single-family” housing on large lots. These areas consume vast amounts of land while housing relatively few people compared to urban apartment blocks.
- Leapfrog Development: Developers often skip over expensive land close to the city to build on cheaper rural land much further out. This creates a “patchwork” of isolated subdivisions separated by empty fields or forests.
- Strip Development: Commercial activities (big-box stores, fast-food chains, gas stations) cluster in long “strips” along major highways. This creates a “ribbon” of development that lacks a true community center.
- Single-Use Zoning: Unlike historic cities where people lived above shops, sprawl strictly separates land uses. You live in one “zone,” work in another, and shop in a third—making a car mandatory for every daily task.
2. The Problems of Sprawl
The “efficiency” of sprawl for the individual homebuyer often translates into a massive “tax” on the environment and society.
Economic Problems
- Infrastructure “Tax”: It is significantly more expensive to provide roads, water, sewage, and electricity to 100 homes spread across 5 miles than to 100 homes in a single city block.
- The Sprawl Subsidy: Many cities go into debt to build the roads and pipes required for new suburbs. Over time, the taxes from those low-density areas often fail to cover the high cost of maintaining that sprawling infrastructure.
Environmental Problems
- Habitat Fragmentation: Sprawl “eats” forests and farmland, destroying wildlife corridors and reducing local food security.
- The Urban Heat Island: Vast oceans of asphalt (parking lots and highways) absorb heat, making sprawling metropolises several degrees hotter than the surrounding countryside.
- Water Runoff: Paved surfaces prevent rainwater from soaking into the ground, leading to increased flooding and the washing of car oils/chemicals into local rivers.
Social and Health Problems
- The “Time Tax”: Residents in sprawling metropolises spend hours in “gridlock” commuting. This leads to higher stress levels and less time for family or community engagement.
- Public Health: Car-dependent design leads to more sedentary lifestyles. Studies show higher rates of obesity and respiratory issues (from smog) in sprawling areas compared to walkable ones.
- Social Isolation: Without shared public spaces like parks or plazas, sprawl can lead to a “bubble” lifestyle where residents rarely interact with neighbors.
3. The Modern Solution: Smart Growth
In response to these problems, many cities are adopting Smart Growth policies:
- Infill Development: Building on vacant or underused lots inside the existing city rather than on the edge.
- Transit-Oriented Development (TOD): High-density housing and offices clustered around train or bus stations.
- Urban Growth Boundaries: Legal “lines in the sand” (like in Portland, Oregon) that forbid building beyond a certain point to protect farmland and forests.
What is the spread city?
A Spread City is a specific urban configuration where a metropolitan area lacks a defined “downtown” or a single dominant core. Unlike a sprawling metropolis, which may still have a clear (though congested) center, a spread city is decentralized and polycentric by design.
The term was popularized in the 1960s to describe the “New York Metropolitan Region,” where development began to look more like a thin, even layer of jam spread across a piece of bread rather than a concentrated mound in the middle.
1. Defining Characteristics
What distinguishes a “Spread City” from other urban forms is its homogeneity:
- No Center of Gravity: Economic activity, entertainment, and housing are distributed relatively evenly. You don’t “go into the city” for work; you drive from one suburb to another.
- The “Galactic” Layout: Activities are scattered like stars in a galaxy. Shopping malls, industrial parks, and office “campuses” are connected by high-speed beltways rather than radiating from a central hub.
- Interchange-Based Growth: In a spread city, the most valuable land is not the “City Center,” but the highway interchange. This is where “Edge Cities” (clusters of offices and retail) emerge.
2. Patterns of the Spread City
The spatial organization of a spread city follows a distinct logic:
| Feature | Pattern |
| Work-Life Flow | “Cross-commuting” (Suburbs to Suburbs) rather than “Radial-commuting” (Suburbs to CBD). |
| Land Use | Extremely low density. Buildings are often surrounded by massive parking lots to accommodate 100% car dependency. |
| Visual Identity | “Anywhere, USA” syndrome. Strips of fast food, big-box retail, and identical office parks make it difficult to tell one part of the city from another. |
| Social Logic | Privatization of space. Public life happens in “quasi-public” spaces like malls or private gyms rather than public squares or parks. |
3. The “Cost” of the Spread City
While the spread city offers residents more “space” and lower land costs, it creates a high-friction environment:
- Infrastructure Inefficiency: Because everything is spread out, the “linear feet” of pipe, wire, and road per person is at its highest possible level. This makes maintenance a massive financial burden for local governments.
- The Transit Failure: Mass transit (trains/buses) is almost impossible to operate efficiently in a spread city because there are no “high-volume” corridors. Everyone is going to different places at different times.
- Environmental Impact: High carbon footprints are baked into the geography. Because walking is physically impossible, every errand requires a vehicle trip.
[Image comparing the transit accessibility of a monocentric city vs. a spread city]
4. Spread City vs. Sprawl
While often used interchangeably, there is a subtle difference:
- Sprawl is a process of growth (moving outward).1
- Spread City is the result or the form (the final decentralized state).
A city can “sprawl” for a while but still have a strong downtown (like Chicago). A “Spread City” has reached a stage where the downtown is just one node among many, or has been abandoned entirely for the “suburban fringe.”
Summary: The “Network” City
The Spread City represents the ultimate victory of the automobile over the pedestrian. It is a city organized as a network of nodes rather than a hierarchy with a king at the center.
What causes urban spread?
Urban spread (or sprawl) is rarely the result of a single factor. Instead, it is caused by a “perfect storm” of economic incentives, government policies, and technological shifts that make horizontal expansion more attractive than vertical density.
The causes can be categorized into four primary drivers:
1. Transportation and Infrastructure
The most significant catalyst for urban spread is the accessibility provided by the automobile and high-speed road networks.
- The Highway Revolution: Large-scale government investment in beltways and interstate highways made it possible for people to live 30 miles from their workplace while maintaining a reasonable commute time.
- Car Ownership: As cars became more affordable, the “friction of distance” decreased. This shifted the city’s logic from proximity (how close am I?) to velocity (how fast can I get there?).
- Infrastructural Subsidies: In many regions, the cost of building new roads and utility lines to the city’s edge is socialized (paid for by all taxpayers), which artificially lowers the price for developers to build “out” rather than “up.”
2. Economic Factors and Land Value
The Bid-Rent Theory explains that land prices are highest in the city center and drop as you move outward.
- Lower Land Costs: Developers can buy massive tracts of rural land at a fraction of the cost of urban plots. This allows them to build larger, “more affordable” homes that appeal to middle-class families.
- The Search for Space: Businesses, particularly large-scale retail (big-box stores) and warehousing, spread to the periphery because they require large “floor plates” that are physically impossible or too expensive to build in a dense core.
3. Socio-Cultural Preferences
Public perception and the “American Dream” (or its global equivalents) play a massive role in spatial organization.
- The “Filtering” Process: As inner cities become older and more congested, those with the financial means “filter” out to newer, cleaner developments on the edge.
- School Quality and Safety: Perceptions (and often realities) of better school districts and lower crime rates in the suburbs act as a powerful “pull factor” for families.
- Privacy and Autonomy: The cultural desire for private green space (yards) and the separation of “home life” from “work life” drives the demand for low-density residential zones.
4. Institutional and Policy Drivers
Urban spread is often legally “baked into” the map through government regulation.
- Single-Use Zoning: Many municipal laws make it illegal to build apartments, shops, and offices in the same neighborhood. This forces a spread-out, segregated land-use pattern.
- Mortgage Incentives: Historically, government-backed loans (like the GI Bill in the US) favored new construction in the suburbs over the renovation of older urban homes, effectively subsidizing the move to the edge.
- Fragmentation of Governance: When a metropolitan area is split into dozens of small suburban municipalities, they often compete to attract high-value residents and “clean” businesses (like tech offices), leading to a scattered, uncoordinated “spread city” structure.
Summary: The “Sprawl Cycle”
- New Road Built: Opens up cheap rural land.
- Residential Development: People move for larger homes and lower prices.
- Retail Follows: Shopping malls and “strips” open to serve the new residents.
- Congestion Hits: The new road becomes clogged, leading to demands for another highway further out, starting the cycle again.
What is the Urban Realms Model?
The Urban Realms Model is a 20th-century urban geography framework proposed by James E. Vance Jr. in 1964.1 It is often considered the most modern and realistic of the classical North American city models because it accounts for the impact of the automobile and the rise of self-sufficient suburbs.2
Unlike earlier models that viewed the city as a single entity revolving around one downtown, the Urban Realms Model describes a metropolis as a collection of independent, specialized “realms” that are linked together to form a larger metropolitan framework.3
1. Core Principles: The “Kingdoms” of the City
Vance used the term “realm” to suggest that parts of a city had become so large and independent that they functioned like their own little “kingdoms.”
- Decentralization: The Central Business District (CBD) is no longer the undisputed king.4 Most residents in an “Urban Realm” can live, work, and shop without ever needing to go to the original downtown.
- Self-Sufficiency: Each realm contains its own “suburban downtown,” specialized industrial parks, and residential neighborhoods.5
- The “Pepperoni Pizza” Model: Some students call it this because the realms look like scattered toppings on a base. Each realm has its own focal point (an edge city or a major shopping mall) instead of a single central bullseye.6
2. Factors That Shape a “Realm”
Vance argued that the size and character of these realms are determined by five specific criteria:7
- Topography: Physical barriers like mountains, rivers, or bays (crucial in Vance’s study of San Francisco).
- Size of Metropolis: Larger cities naturally fracture into more realms.
- Economic Strength: How much business activity is happening within the realm itself.8
- Internal Accessibility: How easy it is to travel within the realm (usually via a local highway network).
- Inter-Accessibility: How well the realm connects to other realms and the main city core.
3. Urban Realms vs. Multiple Nuclei
It is easy to confuse this with the Multiple Nuclei Model, but there is a key difference in how they view the city’s organization:
| Feature | Multiple Nuclei Model (1945) | Urban Realms Model (1964) |
| Primary Hub | One main CBD + secondary nodes. | Multiple independent downtowns. |
| Connection | Nodes are part of one single city system. | Realms are independent entities linked together. |
| Suburbs | Suburbs are mostly “bedroom” communities. | Suburbs are Self-Sufficient (Edge Cities). |
| Driver9 | Specialized land use clusters.10 | Automobile/Superhighways.11 |
4. Real-World Application: The San Francisco Bay Area12
Vance developed this model while observing San Francisco.13 He noticed that cities like Oakland, San Jose, and the Silicon Valley weren’t just “satellites” of San Francisco; they had become their own urban realms with high-tech jobs, international airports, and distinct political identities.
Today, this model is the best fit for sprawling, “galactic” cities like Los Angeles, Atlanta, and Phoenix, where the original downtown is often less economically powerful than the suburban office clusters that surround it.
Urban Geography Models Breakdown
This video provides a helpful visual comparison of how modern models like the Multiple Nuclei and Urban Realms theories improved upon older concentric and sector-based ideas.
What problems exist with the city?
When we talk about “problems with the city” in an urban planning context, we aren’t just talking about individual issues like a single pothole or a specific crime. We are looking at systemic failures—situations where the way the city is organized actually creates or worsens the problem.
These problems generally fall into three categories: Physical/Environmental, Economic, and Social.
1. Physical and Environmental Stresses
As cities become more “spread” or “sprawling,” the physical environment suffers due to the sheer intensity of human activity.1
- The Urban Heat Island Effect: Cities are often $5^{\circ}C$ to $10^{\circ}C$ warmer than surrounding rural areas. This is caused by “dark” infrastructure (asphalt roads, tar roofs) absorbing solar radiation and a lack of vegetation to provide evaporative cooling.2
- Infrastructure Decay (The “Funding Gap”): Many older cities face a “deferred maintenance” crisis. The cost of repairing aging water mains, bridges, and subways often exceeds the city’s tax revenue, leading to catastrophic failures.
- Congestion and “Friction of Distance”: When a city’s spatial organization fails, movement grinds to a halt. This isn’t just a nuisance; it’s an economic drain. In cities like Manila or Los Angeles, residents can lose up to 100 hours a year just sitting in traffic.
2. Economic Disparities and “Spatial Mismatch”
A major problem in modern cities is that the “Competitive Building Process” often places jobs where workers cannot afford to live.
- Spatial Mismatch: This occurs when entry-level or industrial jobs move to the suburban “Urban Realms,” but the workers who need those jobs live in the city center with no reliable way to get to the outskirts (since transit is often built for commuting into the city).
- The Affordability Crisis: When demand for central land is high, “Ceiling Rents” or market competition can push low-income residents to the extreme periphery. This creates a “Dual City” where the service workers who keep the city running cannot afford to live within its limits.
- Gentrification and Displacement: As capital flows back into “Zones of Transition,” property values rise. While this improves the tax base, it often severs the social networks and cultural history of the original residents.
3. Social and Governance Challenges
How a city is “governed” can be just as problematic as how it is “built.”
- Jurisdictional Fragmentation: A “Spread City” might be divided into 50 different small municipalities. This leads to “beggar-thy-neighbor” policies where towns compete for a new shopping mall (tax revenue) but push low-income housing or landfills onto the town next door.
- Food Deserts: In many sprawling or neglected urban areas, the “Market Outcome” is a lack of grocery stores. Residents have access to “fast food” but no “fresh food,” leading to long-term public health crises.
- Social Isolation: In low-density, car-dependent sprawl, the “public realm” (sidewalks, parks, plazas) disappears.3 This leads to a loss of “Social Capital”—the informal connections between neighbors that provide security and community support.
4. Summary: The “Vicious Cycle” of Urban Problems
| Problem | Cause | Result |
| Sprawl | Car-dependency | High infrastructure costs & pollution. |
| Blight | Lack of investment | Declining tax base & “vicious cycle” of decay. |
| Inequality | High land costs | Segregation and long commutes for the poor. |
The Big Picture: Most city problems are “Wicked Problems”—they are interconnected. You cannot fix “Congestion” by just building more roads; you have to fix “Land Use” so people don’t have to drive so far in the first place.
What are visions of the future of metropolitan life?
Visions of the future of metropolitan life generally fall into two categories: Technological Optimism, which focuses on efficiency and data, and Human-Centric Design, which focuses on sustainability and social connection.
These visions are a response to the “problems with the city” we discussed earlier, such as sprawl, congestion, and environmental decay.
1. The “Smart City” (The Data-Driven Vision)
The Smart City vision treats the metropolis as a massive, living computer. By embedding sensors into every street, pipe, and building, the city can “optimize” itself in real-time.
- Autonomous Transportation: A city without parking lots. Self-driving electric pods provide “mobility as a service,” allowing streets to be narrowed and converted into green space.
- Dynamic Resource Management: Smart grids that adjust electricity flow based on demand and water pipes that detect their own leaks instantly.
- Predictive Governance: Using AI to predict where traffic jams will form or which infrastructure is likely to fail next.
2. The “15-Minute City” (The Proximity Vision)
Popularized by urbanist Carlos Moreno, this vision seeks to reverse the “Spread City” by making life local again. The goal is that every resident should be able to meet their essential needs within a 15-minute walk or bike ride from their home.
- Mixed-Use Hyper-Density: Breaking down single-use zoning. Offices, grocery stores, clinics, and schools are integrated into residential blocks.
- The End of the Commute: By decentralizing “Urban Realms” even further, the 15-minute city eliminates the need for massive highways, reducing carbon emissions and returning “time” to the citizens.
- Tactical Urbanism: Converting parking spots into “parklets” and closing streets to cars during weekends to encourage community interaction.
3. The “Ecocity” (The Regenerative Vision)
This vision views the city as an extension of the natural world rather than an opponent to it. It aims for a “circular metabolism” where the city produces its own energy and processes its own waste.
- Vertical Farming: Skyscrapers that grow food hydroponically, reducing the “Food Desert” problem and eliminating the environmental cost of trucking produce from the countryside.
- Biophilic Design: Integrating nature into the architecture—living walls, rooftop forests, and daylighting buried rivers to manage floodwaters and combat the Urban Heat Island effect.
- Zero-Waste Infrastructure: Transforming sewage and trash into biogas and recycled building materials on-site.
4. The “Post-Work” or “Remote” Metropolis
Triggered by the digital revolution, this vision suggests that the physical “center” of the city may become obsolete.
- The Zoom Town: A shift in the Residential Location Decision. If proximity to the office doesn’t matter, cities may reorganize around “lifestyle amenities” (culture, food, nature) rather than job centers.
- Adaptive Reuse: Converting abandoned downtown office towers into housing or community centers, shifting the CBD from a place of transaction to a place of interaction.
Summary of Future Visions
| Vision | Priority | Primary Technology |
| Smart City | Efficiency & Optimization | AI, IoT, Big Data |
| 15-Minute City | Social Equity & Health | Micromobility, Walking |
| Ecocity | Sustainability | Renewables, Vertical Farming |
| Post-Work City | Flexibility & Quality of Life | Remote Tech, High-speed Rail |
The “Dystopian” Alternative
It is important to note that without proper governance, these visions can turn into problems. A “Smart City” could become a Surveillance City; a “15-Minute City” could become a Gated Enclave for the wealthy; and an “Ecocity” could be too expensive for the average resident, leading to further Spatial Mismatch.
Solved Problems
1. Bid-Rent & Competitive Building
Question: A city’s Central Business District (CBD) is undergoing rapid tech-sector growth. A small community garden currently occupies a prime 1-acre lot. Using the Competitive Building Process, explain why the garden is likely to disappear and what will replace it.
Solution: The tech boom increases the Bid-Rent potential for office space. While the garden provides social value, it generates near-zero economic “rent.” A developer will outbid all other users because they can build a high-density office tower (HABU – Highest and Best Use) that generates enough revenue to cover the extreme land cost.
2. Intraurban Organization
Question: A city shifts from a Monocentric to a Polycentric structure. How does this affect the daily “Flows” within the city’s spatial organization?
Solution: In a monocentric city, flows are radial (everyone moves toward the center in the morning). In a polycentric city, flows become cross-metropolitan. Traffic patterns become more complex and decentralized, often making traditional “hub-and-spoke” transit systems inefficient.
3. Ceiling Rents & Housing Supply
Question: A city implements a strict Ceiling Rent on all apartments to help low-income residents. Ten years later, the city has a massive housing shortage and many buildings are crumbling. Explain the economic link.
Solution: The ceiling rent sits below the market equilibrium. This removes the incentive for developers to build new units (lowering supply) and prevents landlords from earning enough profit to pay for repairs (maintenance deterioration), leading to a decline in quality.
4. Residential Location Decisions
Question: A high-income family chooses to move from a downtown loft to a far-flung “Exurb” 40 miles away. Based on the Alonso-Muth-Mills model, what was the likely trigger for this decision?
Solution: The family’s desire for space (utility from a large yard/house) finally outweighed their transportation costs (the time/money spent commuting). This often happens when household size increases (e.g., having children).
5. Site Demands of Firms
Question: A “Weight-Gaining” industry (like a soft-drink bottling plant) is looking for a new site. Should they prioritize a site near the source of their raw materials or near their urban customers?
Solution: They should prioritize a site near the market (customers). Since the finished product is heavier/bulkier than the raw inputs, it is cheaper to move the ingredients to the city and bottle them there than to ship heavy crates of liquid from a remote source.
6. The Sector Model in Practice
Question: In a city following the Hoyt Sector Model, a new heavy-rail freight line is built on the West Side. Where is low-income housing most likely to develop in 20 years?
Solution: Low-income housing will develop in a “wedge” immediately bordering the rail line. This is because industrial firms will cluster there for transport, and the resulting noise/pollution will lower land values, making it the only sector affordable for low-income workers.
7. Multiple Nuclei & Specialized Hubs
Question: An international airport is built 15 miles outside a city. According to the Multiple Nuclei Model, what specific “nucleus” will likely form around it?
Solution: A transport/logistics nucleus will form, consisting of hotels, warehouses, and “just-in-time” manufacturing firms. This area acts as a secondary CBD, attracting its own workforce and residential pockets.
8. Latin American City Structures
Question: A Latin American city experiences “gentrification.” In which zone is this most likely to occur according to the Griffin-Ford Model?
Solution: Gentrification is most likely in the Zone of Maturity or along the Commercial Spine. These areas have the best infrastructure and historic value, making them prime targets for redevelopment as high-income residents seek to be near the elite core.
9. Southeast Asian Port Cities
Question: In a city modeled after the McGee Model, the government wants to build a new financial district. Why might they struggle to find a single “Central Business District” to put it in?
Solution: The McGee model is fragmented. There is no single CBD; commercial activity is split between the Western Zone, the Alien (Chinese) Zone, and the Government Zone. The financial district would likely cluster in the “Western Commercial Zone” rather than a traditional land-based center.
10. African City Structure
Question: You are a merchant in a Sub-Saharan African city. You need to sell traditional textiles. Which of the three CBDs should you locate in?
Solution: You should locate in the Traditional/Market CBD. This zone is characterized by informal trade and open-air markets, which is the primary hub for local cultural and textile commerce.
11. Sprawling Metropolis Problems
Question: A sprawling metropolis faces a “Fiscal Crisis” regarding its water pipes. Why is the sprawl itself to blame?
Solution: Low density. The city has to lay miles of expensive pipe to reach a few hundred people in the suburbs. The tax revenue from those few houses is often not enough to cover the long-term maintenance of the massive infrastructure network required to serve them.
12. The Spread City & Transit
Question: Why is a “Spread City” almost impossible to serve with a traditional subway system?
Solution: Subways require nodes of high density to be efficient. In a spread city, jobs and homes are “spread” evenly like jam. There are no high-traffic corridors, meaning a train would run mostly empty between scattered, low-density destinations.
13. Causes of Urban Spread
Question: A city builds a massive “Beltway” (ring road) to solve downtown congestion. Why does this often lead to more sprawl?
Solution: It increases accessibility to rural land. Suddenly, land that was “too far” is now a 20-minute drive away. Developers buy this cheap land, people move out, and the resulting development creates “Induced Demand” that eventually clogs the new beltway.
14. The Urban Realms Model
Question: A resident of an “Urban Realm” realizes they haven’t visited the actual downtown core in three years. Why does the Urban Realms Model explain this?
Solution: The model highlights self-sufficiency. The resident’s “realm” (e.g., an Edge City) provides all their needs—work, shopping, and healthcare—meaning the original CBD is no longer the functional center of their life.
15. Future Visions: The 15-Minute City
Question: How does the 15-Minute City vision attempt to solve the “Spatial Mismatch” problem?
Solution: It eliminates the mismatch by re-integrating land use. By putting jobs, services, and housing in the same 15-minute walking radius, it ensures that low-income workers can access employment without the “tax” of expensive, unreliable commutes to distant suburbs.